HP EliteDesk 800 G1, Core i5-4590, 8GB, 120GB SSD, Black
CPU Intel Core i5 4590
RAM 8 GB
Storage 120 GB
GPU Intel HD Graphics 4600
Form Factor sff
psu w 240
OS Windows 10 Pro

35 Score global
Aucun prix actuel chez les marchands
Aperçu
Avantages et inconvénients
Points forts
- Strong port selection (72nd percentile) 72nd
- Strong reliability (70th percentile) 70th
Points faibles
- Below average storage (5th percentile)
- Below average ram (9th percentile)
- Below average cpu (13th percentile)
- Below average gpu (18th percentile)
Les preuves
Performances
Caractéristiques techniques
Fiche technique complète
Processor
| CPU | Intel Core i5 4590 |
| Cores | 4 |
| Frequency | 3.3 GHz |
| L3 Cache | 6 MB |
Graphics
| GPU | Intel HD Graphics 4600 |
| Type | Integrated |
Memory & Storage
| RAM | 8 GB |
| RAM Generation | DDR3 |
| Storage | 120 GB |
| Storage Type | SSD |
Build
| Form Factor | sff |
| PSU | 240 |
| Weight | 9.3 kg / 20.5 lbs |
Connectivity
| USB Ports | 10 |
| DisplayPort | 2x DisplayPort |
| Bluetooth | Bluetooth 4.0 |
| Ethernet | Gigabit Ethernet |
System
| OS | Windows 10 Pro |
Face à la concurrence
| Spec | HP EliteDesk 800 G1 | Apple Mac Studio M5 Max | Lenovo T Series Towers Legion Tower 5a Gen 10 | Dell Desktop ECT1250 | ASUS ROG GM700 | MSI Aegis ZS2 A9NVP-1407US |
|---|---|---|---|---|---|---|
| CPU | Intel Core i5 4590 | Apple M5 Max | AMD Ryzen 7 7800X3D | Intel Core Ultra 7 265 | AMD Ryzen 7 9800X3D | AMD Ryzen 9 9900X |
| RAM (GB) | 8 | 36 | 32 | 32 | 32 | 32 |
| Storage (GB) | 120 | 1024 | 4096 | 2048 | 2048 | 2048 |
| GPU | Intel HD Graphics 4600 | Apple (32-Core) | NVIDIA GeForce RTX 5070 Ti | Intel UHD Graphics | NVIDIA GeForce RTX 5070 Ti | NVIDIA GeForce RTX 5070 |
| Form Factor | sff | mini | mid-tower | sff | mid-tower | mid-tower |
| Psu W | 240 | 480 | 850 | 180 | 850 | 750 |
| OS | Windows 10 Pro | macOS | Windows 11 Home | Windows 11 Home | Windows 11 Home | Windows 11 Home |
| Compare | Compare | Compare | Compare | Compare |
| Produit | CPU | GPU | RAM | Connectique | Stockage | Fiabilité |
|---|---|---|---|---|---|---|
| HP EliteDesk 800 G1 | 12.7 | 18.4 | 9.1 | 72.1 | 4.5 | 69.9 |
| Apple Mac Studio M5 Max Compare | 95.7 | 85.2 | 92.4 | 89 | 68.8 | 99.3 |
| Lenovo T Series Towers Legion Tower 5a Gen 10 Compare | 73.3 | 94.6 | 77.9 | 88.3 | 98.1 | 69.9 |
| Dell Desktop ECT1250 Compare | 88.2 | 60.3 | 81.6 | 74.5 | 82.7 | 69.9 |
| ASUS ROG GM700 Compare | 80.5 | 94.6 | 81.6 | 96 | 90 | 37.2 |
| MSI Aegis ZS2 A9NVP-1407US Compare | 92.4 | 90.8 | 87 | 90.4 | 82.7 | 37.2 |
Prix
Rapport qualité-prix
Nous suivons les prix de ce produit depuis le 7 juin 2026. Le graphique apparaîtra dès que nous aurons plus de données.
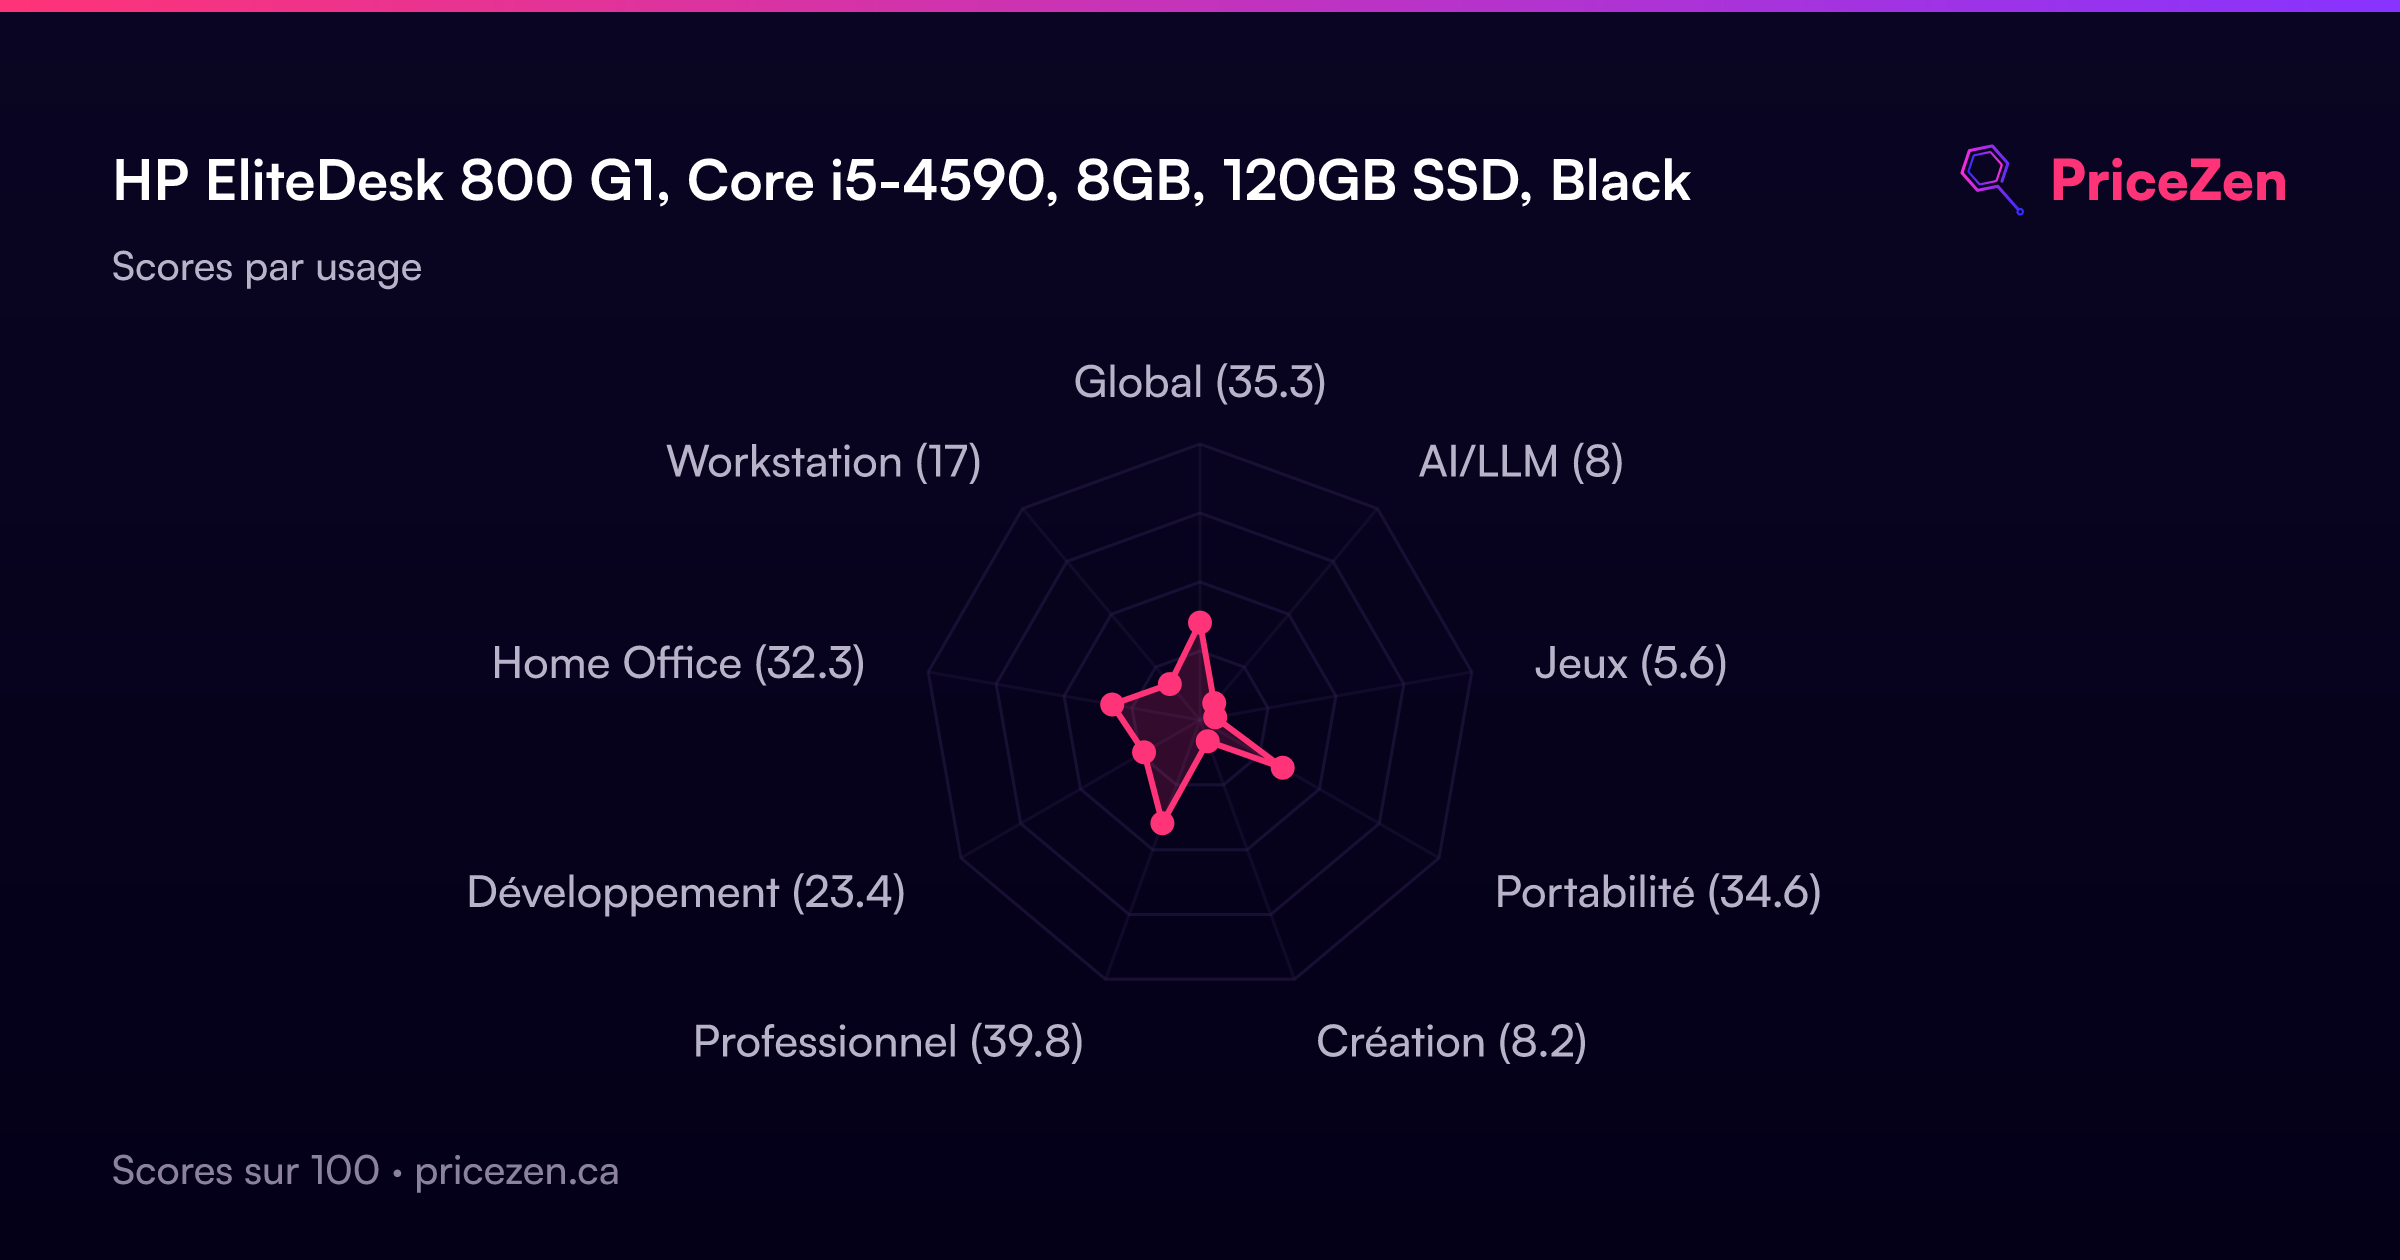
Scores par usage
- Global35.2
- AI/LLM8
- Jeux5.6
- Portabilité34.5
- Création8.2
- Professionnel39.7
- Développement23.3
- Home Office32.2
- Workstation17
Un test complet arrive bientôt. Les caractéristiques, scores, prix et graphiques ci-dessus sont toujours à jour.
Autres configurations23
EliteDesk 800 G1Intel Core i5-457012GB250GBBlack300 $CAEliteDesk 800 G1Intel Core i5 45708GB240GBBlack314 $CAEliteDesk 800 G1Intel Core i5 46908GB500GB385 $CAEliteDesk 800 G1Intel Core i5 46708GB500GB385 $CAEliteDesk 800 G1 SFFIntel Core i7 477016GB1280GB400 $CAEliteDesk 800 G1Intel Core i5 46908GB250GBBlackEliteDesk 800 G1Intel Core i5 459016GB740GBBlackEliteDesk 800 G1 SFFIntel Core i7 477016GB480GBBlackEliteDesk 800 G1Intel Core i5 469016GB128GB
Afficher les 23 configurations
EliteDesk 800 G1Intel Core i5-457016GB500GBBlackEliteDesk 800 G1Intel Core i5 469012GB500GBEliteDesk 800 G1Intel Core i5-457016GB256GBBlackEliteDesk 800 G1 SFFIntel Core i516GB256GBBlackEliteDesk 800 G1Intel Core i5-46708GB128GBBlackEliteDesk HP 800 G1Intel Core i5 459016GB1280GBEliteDesk 800 G1Intel Core i5 4590S8GB180GBBlackEliteDesk 800 G1Intel Core i5-457016GB1TBBlackEliteDesk 800 G1Intel Core i5-459016GB512GBBlackEliteDesk 800 G1 SFFIntel Core i5 45708GB256GBBlackEliteDesk 800 G1-SFFIntel Core i5 45708GB500GBBlack/SilverEliteDesk 800 G1 SFFIntel Core i7 47708GB256GBBlackEliteDesk HP EliteDesk 800 G1Intel Core i5 457016GB240GBEliteDesk 800 G1Intel Core i5 4th Gen16GB512GBBlack