Nouveau
Ritek A801 1TB PCIe 4.0 x4 NVMe M.2 2280
Capacity 1TB
Form Factor M.2 2280
Interface PCIe 4.0 x4
Read Speed 5,000 MB/s
NAND TLC

54 Score global
Prix 242 $CA Habituellement 242 $CA · un magasin, 71 jours de prix


Aperçu
Avantages et inconvénients
Points forts
- Strong speed (75th percentile) 75th
Points faibles
Les preuves
Performances
Caractéristiques techniques
Fiche technique complète
Drive
| Capacity | 1000 |
| Form Factor | M.2 2280 |
| Interface | PCIe 4.0 x4 |
| Protocol | NVMe |
| PCIe Generation | 4 |
| External | No |
Performance
| Sequential Read (MB/s) | 5000 |
| Sequential Write (MB/s) | 4800 |
Hardware
| NAND | TLC |
| DRAM Cache | No |
Reliability
| Warranty (years) | 5 |
Features
| Heatsink | No |
Face à la concurrence
| Spec | Ritek A801 | Samsung 990 PRO | Kingston 2TB SSD | Western Digital WD_BLACK SN850P | Crucial T700 | Team Group MP44 |
|---|---|---|---|---|---|---|
| Capacity | 1TB | 4TB | 2TB | 4TB | 2TB | 4TB |
| Form Factor | M.2 2280 | M.2 2280 | M.2 2280 | M.2 2280 | M.2 2280 | M.2 2280 |
| Interface | PCIe 4.0 x4 | PCIe 4.0 x4 | PCIe 4.0 | PCIe 4.0 x4 | PCIe 5.0 x4 | PCIe 4.0 x4 |
| Seq Read | 5,000 MB/s | 7,450 MB/s | 7,300 MB/s | 7,300 MB/s | 12,400 MB/s | 7,400 MB/s |
| Nand Type | TLC | TLC | TLC | - | TLC | TLC |
| Dram Cache | false | true | true | true | true | false |
| Endurance | - | 2400 TBW | 2000 TBW | 2400 TBW | 1200 TBW | 2000 TBW |
| Compare | Compare | Compare | Compare | Compare |
| Produit | Speed | Random | Feature | Capacity | Endurance | Preuve sociale | Affordability |
|---|---|---|---|---|---|---|---|
| Ritek A801 | 75.4 | 61.8 | 52.2 | 55.3 | 57.1 | 40.2 | 58.6 |
| Samsung 990 PRO Compare | 93.8 | 97.9 | 93.9 | 92.6 | 85.7 | 94.9 | 7.2 |
| Kingston 2TB SSD Compare | 93.4 | 94.4 | 93.9 | 78.5 | 94 | 94.9 | 24.1 |
| Western Digital WD_BLACK SN850P Compare | 89 | 95.8 | 84.1 | 92.6 | 88 | 99.5 | 10.2 |
| Crucial T700 Compare | 96.7 | 97.7 | 97.4 | 78.5 | 82.6 | 75.1 | 21.8 |
| Team Group MP44 Compare | 93.7 | 88.7 | 52.2 | 92.6 | 76.8 | 85.8 | 16.3 |
Prix
Rapport qualité-prix
À partir de 242 $CA
Amazon 1 offre À partir de 242 $CA
Nous suivons les prix de ce produit depuis le 8 nov. 2026. Le graphique apparaîtra dès que nous aurons plus de données.
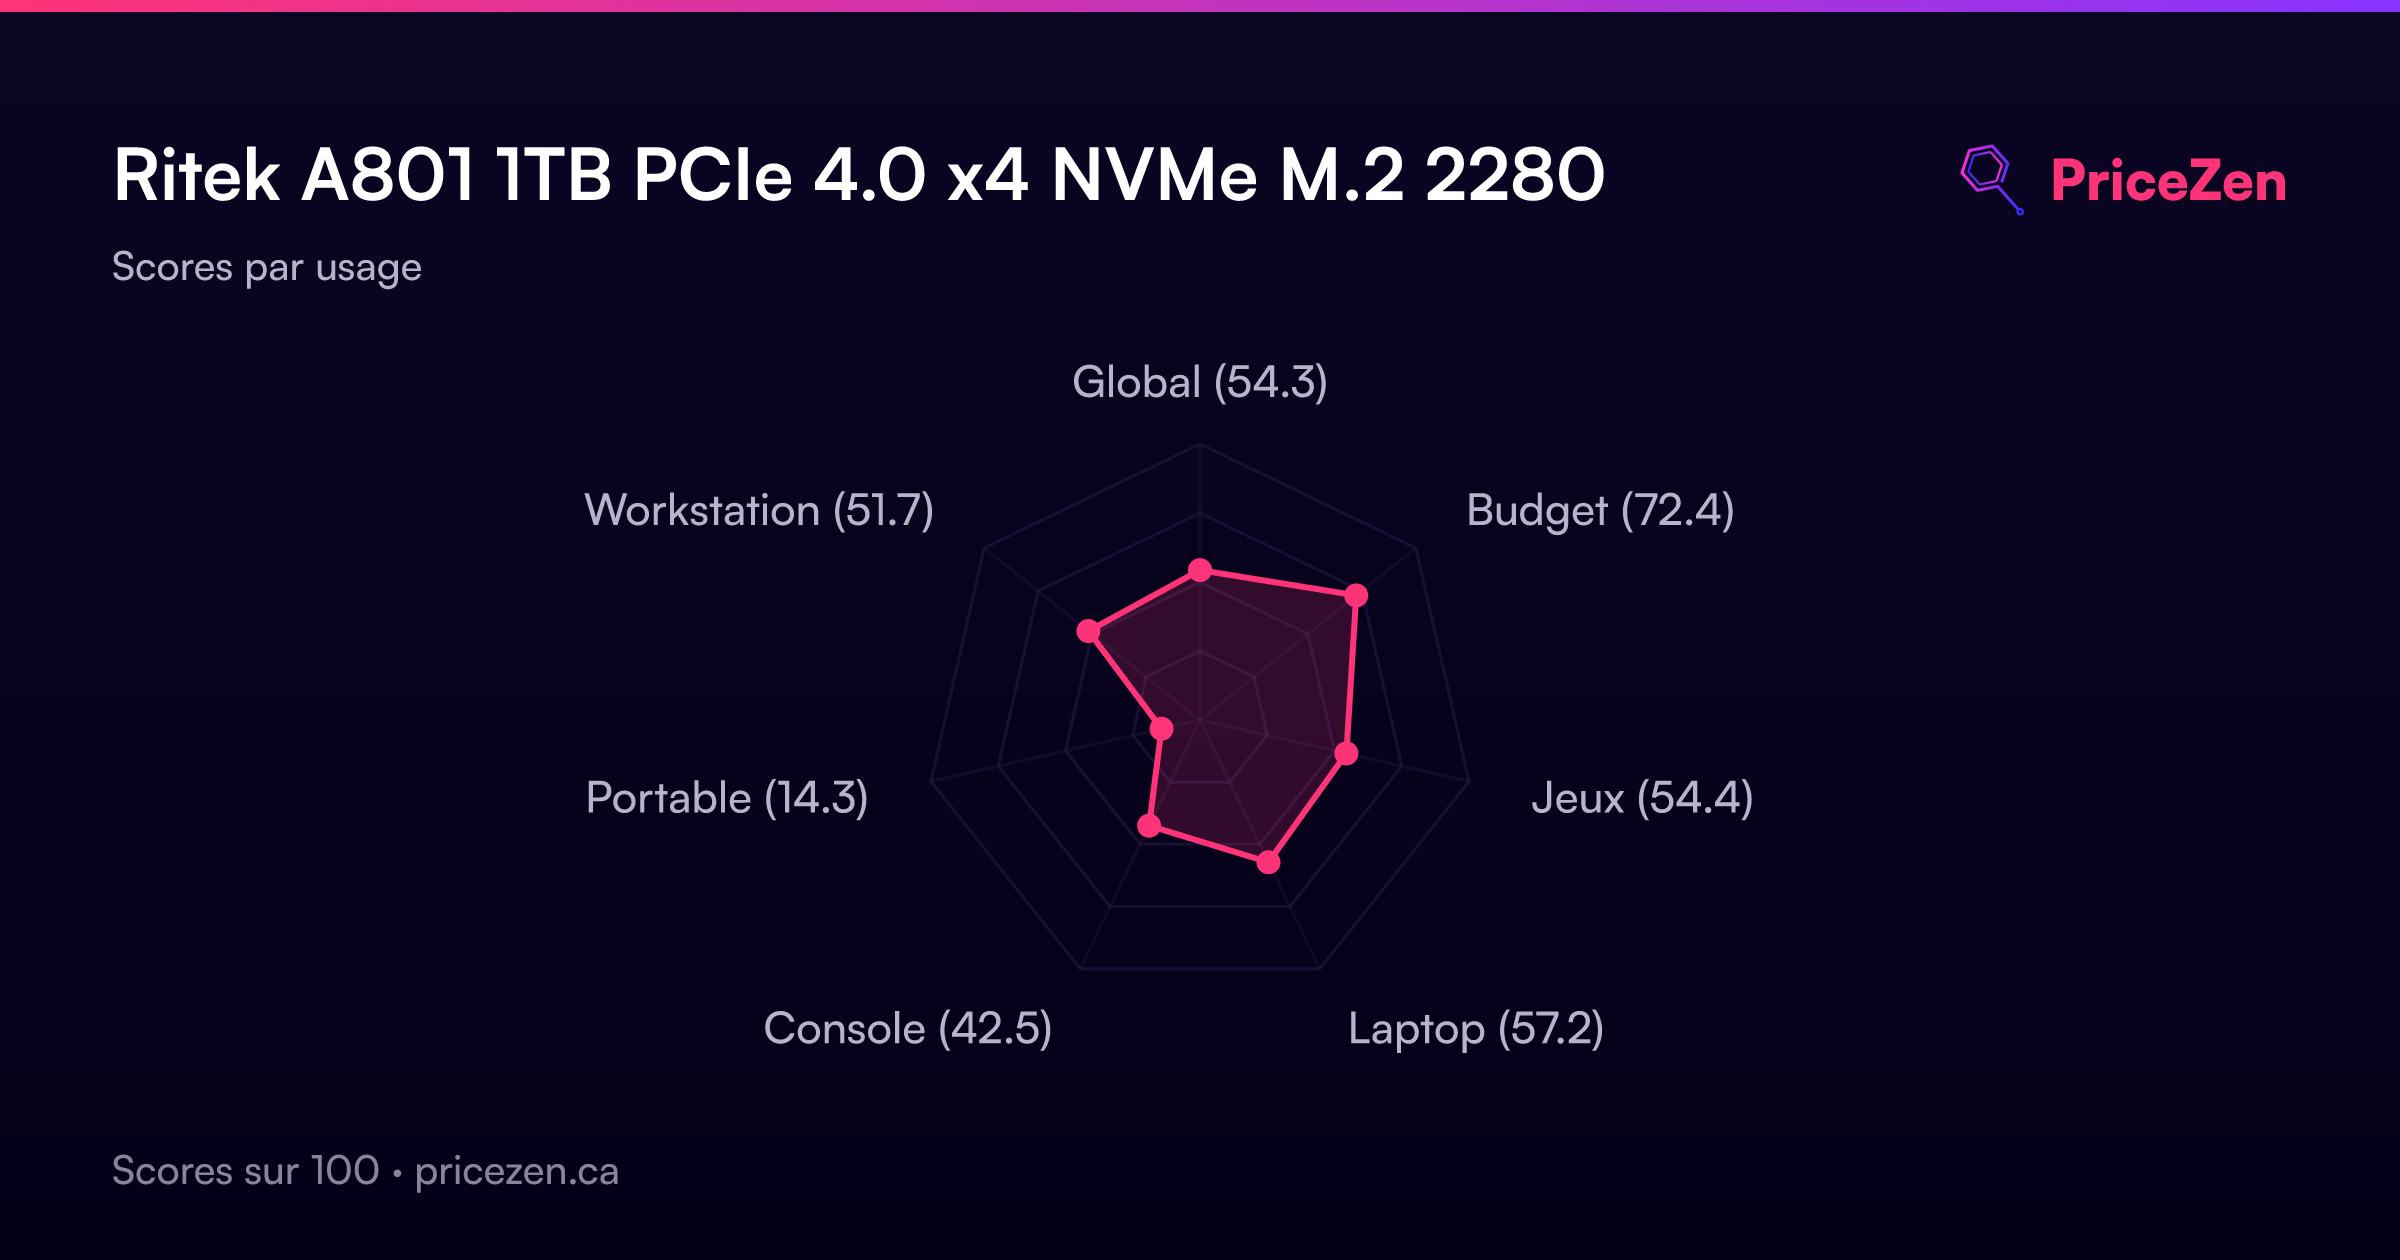
Scores par usage
- Global54.3
- Budget72.4
- Jeux54.4
- Laptop57.2
- Console42.5
- Portable14.3
- Workstation51.7
Un test complet arrive bientôt. Les caractéristiques, scores, prix et graphiques ci-dessus sont toujours à jour.