ASUS GeForce RTX 4070 Ti TUF Gaming 12GB GDDR6X
The Ada Lovelace architecture and 12GB of GDDR6X memory deliver strong 1440p gaming performance with a 26,912 PassMark score, while the TUF Gaming build provides a robust metal exoskeleton and military-grade capacitors for durability. Its 115W TDP keeps power draw and thermals in check without sacrificing the 2000MHz boost clock. This card is best for 1440p gamers who prioritize a quiet, cool, and physically tough GPU over chasing 4K extremes.

Aucun prix actuel chez les marchands











Aperçu
Avantages et inconvénients
Points forts
- Strong raster (85th percentile) 85th
- Strong efficiency (75th percentile) 75th
- Strong rt (70th percentile) 70th
Points faibles
- Below average thermal (7th percentile)
- Below average social proof (7th percentile)
- Below average affordability (26th percentile)
- Below average connectivity (28th percentile)
L'avis des propriétaires
L'évolution de l'avis des propriétaires dans le temps
ExclusivitéD'après la date à laquelle les clients ont rédigé leurs avis - pour voir si l'enthousiasme initial s'est confirmé.
4 avis rédigés, mai 2024 – janv. 2026 : 1 satisfait, 2 mitigés, 1 insatisfait
Sur l’ensemble des 12 notes des boutiques : 3,6★. La plupart des propriétaires notent sans écrire d’avis. Le graphique compte les 4 avis rédigés.
Chaque point est un avis rédigé, placé au mois où il a été écrit. Satisfaits = 4-5★, mitigés = 3★, insatisfaits = 1-2★.
Les preuves
Performances
Caractéristiques techniques
Fiche technique complète
Chipset
| GPU Chipset | GeForce RTX 4070 Ti |
| Brand | NVIDIA |
| Architecture | Ada Lovelace |
| Class | consumer |
| Process | 5 |
Memory
| VRAM | 12 GB |
| Memory Type | GDDR6X |
| Memory Bus | 128 |
| Bandwidth | 480 |
Compute
| CUDA Cores | 4608 |
| Tensor Cores | 144 |
| RT Cores | 36 |
| Base Clock | 1230 |
| Boost Clock | 2000 |
| FP16 TFLOPS | 29.15 |
| FP32 TFLOPS | 29.15 |
Performance
| PassMark G3D | 31550 |
| GPU Compute | 14631 |
Power & Cooling
| TDP | 285 |
| Recommended PSU | 550 |
Connectivity
| Interface | PCI Express 4.0 x16 |
| DisplayPort | 1 |
| HDMI | 1 |
Physical
| Weight | 0.3 kg / 0.7 lbs |
Features
| Ray Tracing | Yes |
Face à la concurrence
| Spec | ASUS GeForce RTX 4070 Ti TUF Gaming | Gigabyte GeForce RTX 5070 Ti Eagle Ice | MSI GeForce RTX 5070 Ti Ventus 3X OC | ZOTAC GeForce RTX 5080 APOCALYPSE | PNY GeForce RTX 5080 ARGB OC | Sapphire Radeon RX 9070 XT PULSE |
|---|---|---|---|---|---|---|
| Chipset | GeForce RTX 4070 Ti | GeForce RTX 5070 Ti | GeForce RTX 5070 Ti | GeForce RTX 5080 | GeForce RTX 5080 | Radeon RX 9070 XT |
| Vram | 12GB GDDR6X | 16GB GDDR7 | 16GB GDDR7 | 16GB GDDR7 | 16GB GDDR7 | 16GB GDDR6 |
| Boost Clock Mhz | 2000 | 2542 | 2482 | 2730 | 2620 | 2970 |
| Tdp W | 285 | 300 | 300 | 360 | 360 | 304 |
| Memory Bus Bits | 128 | 256 | 256 | 256 | 256 | 256 |
| Ray Tracing | true | true | true | true | true | true |
| GPU Class | consumer | consumer | consumer | consumer | consumer | consumer |
| Compare | Compare | Compare | Compare | Compare |
| Produit | AI | Rt | Vram | Raster | Compute | Feature | Thermal | Efficiency | Connectivity | Preuve sociale | Affordability |
|---|---|---|---|---|---|---|---|---|---|---|---|
| ASUS GeForce RTX 4070 Ti TUF Gaming | 57.8 | 69.9 | 58.9 | 84.7 | 64 | 33.9 | 6.5 | 75.2 | 28.1 | 6.7 | 25.5 |
| Gigabyte GeForce RTX 5070 Ti Eagle Ice Compare | 79.6 | 88.7 | 86 | 89 | 88.2 | 96 | 91.6 | 72.2 | 94.1 | 95.5 | 26.8 |
| MSI GeForce RTX 5070 Ti Ventus 3X OC Compare | 79.6 | 92.4 | 86 | 89 | 88.2 | 96 | 91.6 | 72.2 | 94.1 | 88.9 | 23.4 |
| ZOTAC GeForce RTX 5080 APOCALYPSE Compare | 85.7 | 97.5 | 89 | 94.5 | 93.5 | 96 | 91.6 | 57.1 | 94.1 | 99.1 | 20.4 |
| PNY GeForce RTX 5080 ARGB OC Compare | 85.7 | 97.5 | 89 | 94.5 | 93.5 | 96 | 91.6 | 57.1 | 94.1 | 82.8 | 14.5 |
| Sapphire Radeon RX 9070 XT PULSE Compare | 89.3 | 84.7 | 73.8 | 75.3 | 90.2 | 96 | 72.3 | 45.7 | 88.8 | 95.5 | 43.3 |
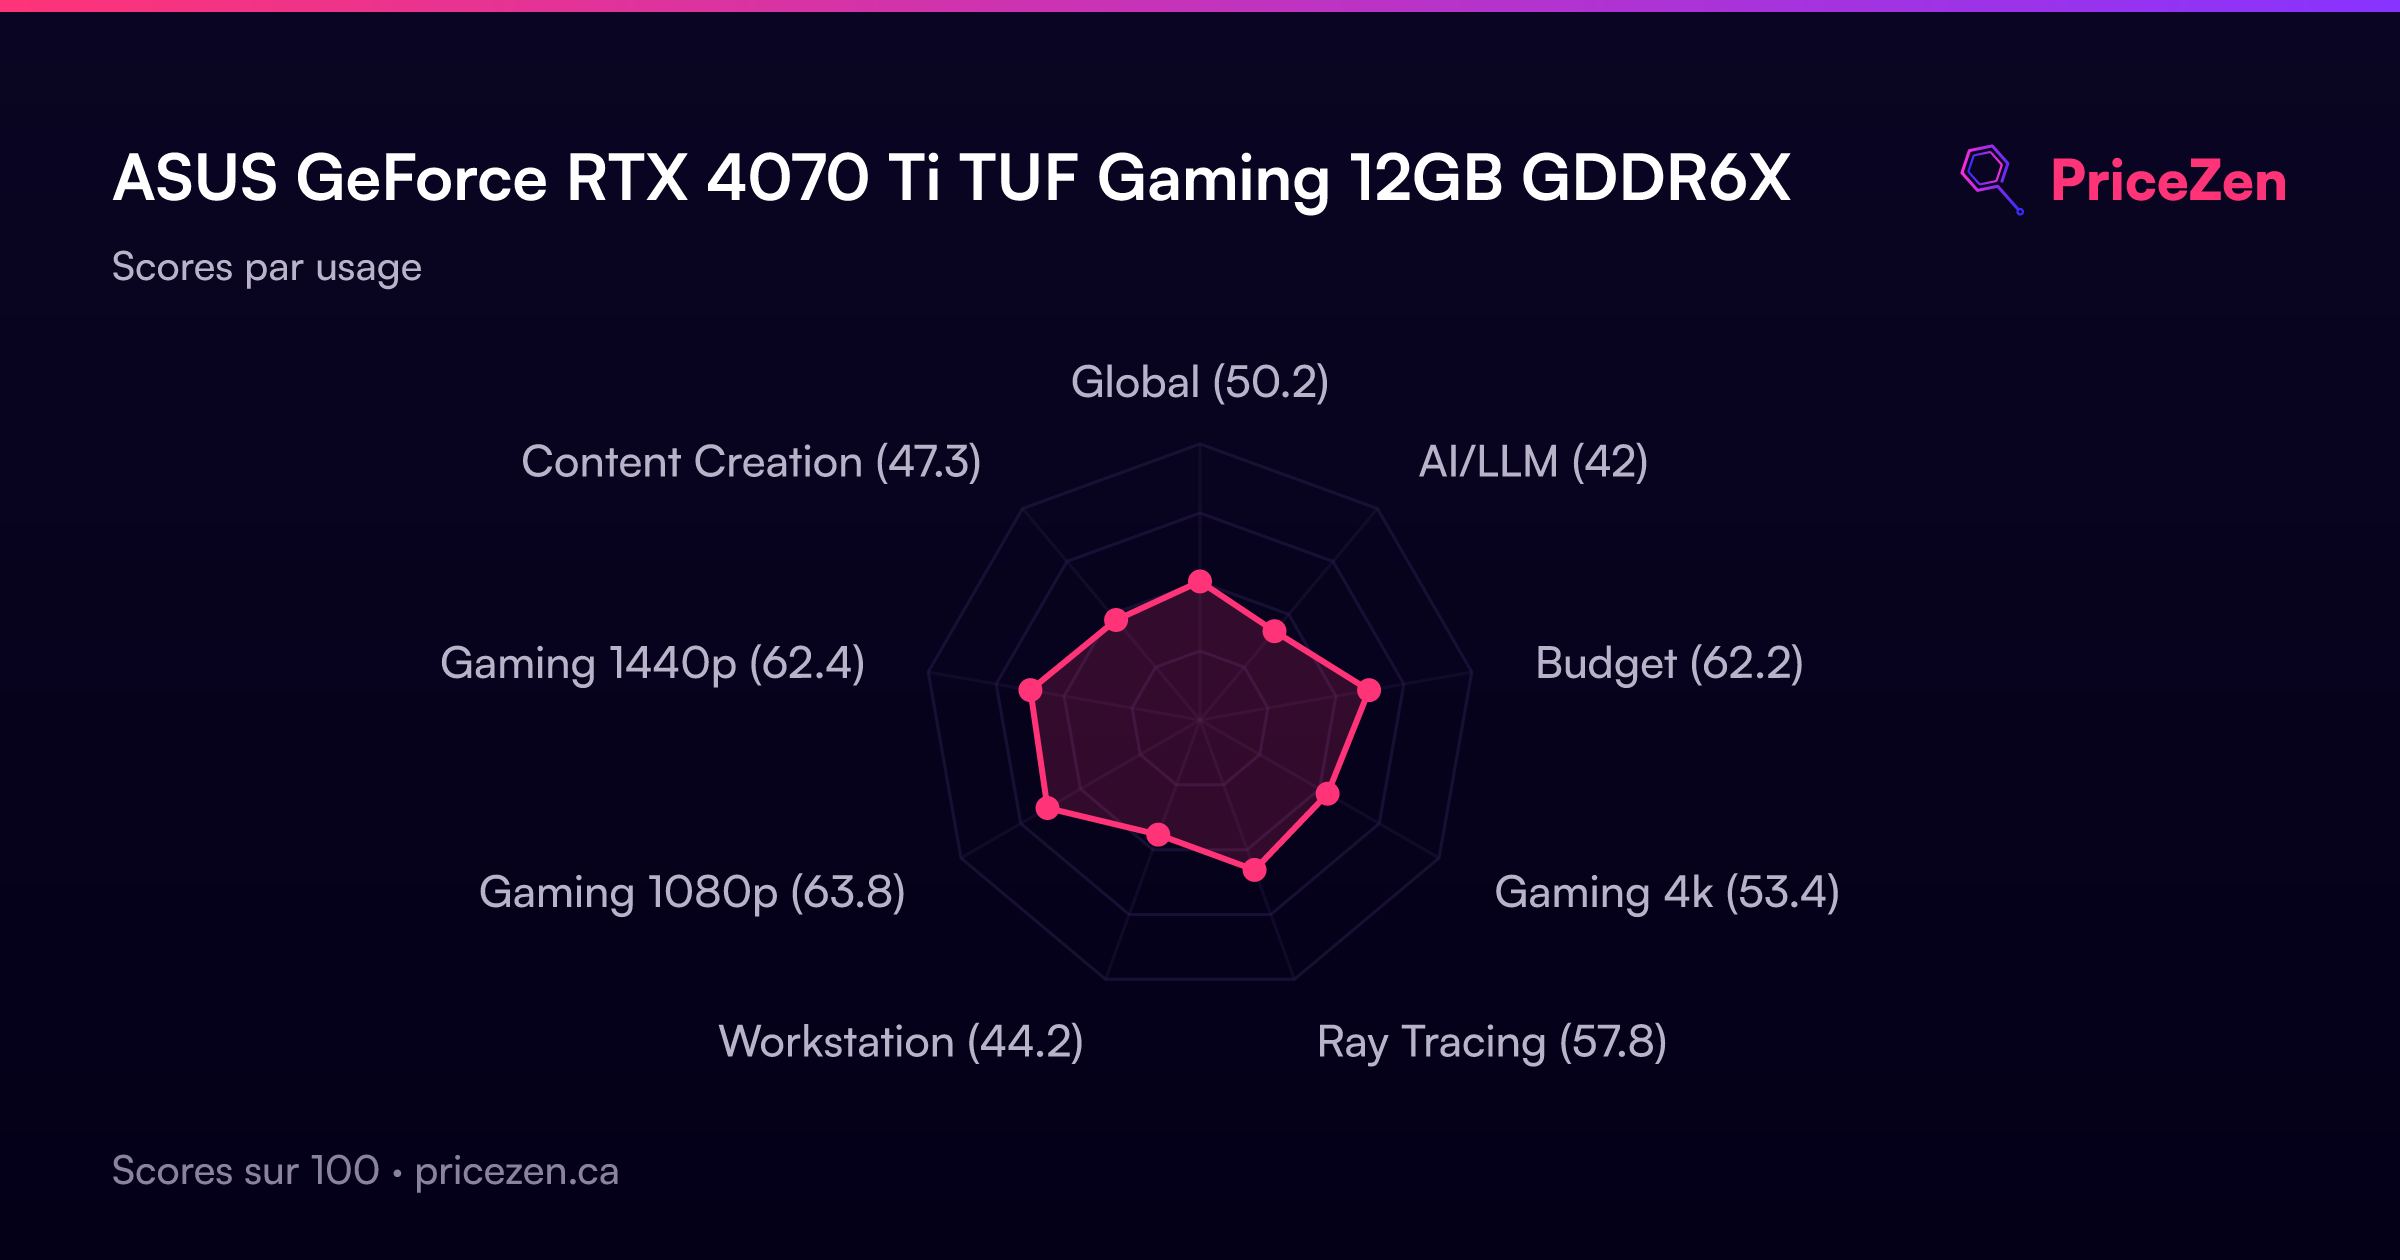
Scores par usage
- Global50.2
- AI/LLM42
- Budget62.2
- Gaming 4k53.4
- Ray Tracing57.8
- Workstation44.2
- Gaming 1080p63.8
- Gaming 1440p62.4
- Content Creation47.3
Un test complet arrive bientôt. Les caractéristiques, scores, prix et graphiques ci-dessus sont toujours à jour.