En promo 10%
HP EliteDesk 16GB RAM, Core i5-6500T, 8GB, 240GB SSD
CPU Intel Core i5 6500T
RAM 8 GB
Storage 240 GB
GPU Intel HD Graphics 530
Form Factor mini
OS Windows 10 Pro

39 Score global
Prix 175 $CA




Aperçu
Avantages et inconvénients
Points forts
- Strong social proof (93rd percentile) 93rd
- Strong reliability (70th percentile) 70th
Points faibles
- Below average storage (8th percentile)
- Below average cpu (8th percentile)
- Below average ram (9th percentile)
- Below average port selection (18th percentile)
Les preuves
Performances
Caractéristiques techniques
Fiche technique complète
Processor
| CPU | Intel Core i5 6500T |
| Cores | 4 |
| Frequency | 2.5 GHz |
| L3 Cache | 6 MB |
Graphics
| GPU | Intel HD Graphics 530 |
| Type | Integrated |
| VRAM Type | GDDR6 |
Memory & Storage
| RAM | 8 GB |
| RAM Generation | DDR4 |
| Storage | 240 GB |
| Storage Type | SSD |
Build
| Form Factor | mini |
| Weight | 1.6 kg / 3.4 lbs |
Connectivity
| HDMI | 1x VGA |
| DisplayPort | 1x DisplayPort |
System
| OS | Windows 10 Pro |
Face à la concurrence
| Spec | HP EliteDesk 16GB RAM | Minisforum DeskMini UM880 Plus | Dell OptiPlex 3070 Small Form Factor | ASUS NUC 15 Pro RNUC15CRKU50000U | Lenovo ThinkCentre M70q | MSI Cubi NUC 1MG-295US |
|---|---|---|---|---|---|---|
| CPU | Intel Core i5 6500T | AMD Ryzen 7 255 | Intel Core i7 9700 | Intel Core Ultra 5 225H | Intel Core i5 12500T | Intel Core 3 100U |
| RAM (GB) | 8 | 32 | 32 | 96 | 16 | 16 |
| Storage (GB) | 240 | 1024 | 1024 | 96 | 256 | 500 |
| GPU | Intel HD Graphics 530 | AMD Radeon 780M | Intel UHD Graphics 630 | Intel Arc 130T | Intel Graphics | Intel Graphics |
| Form Factor | mini | mini | sff | mini | mini | mini |
| Psu W | - | 120 | - | 120 | 135 | 120 |
| OS | Windows 10 Pro | Windows | Windows 11 Pro | No OS | Windows 11 Pro | Windows 11 Home |
| Compare | Compare | Compare | Compare | Compare |
| Produit | CPU | GPU | RAM | Connectique | Stockage | Fiabilité | Preuve sociale |
|---|---|---|---|---|---|---|---|
| HP EliteDesk 16GB RAM | 8.3 | 22 | 9.1 | 18.3 | 8 | 69.9 | 93.3 |
| Minisforum DeskMini UM880 Plus Compare | 65 | 64.9 | 81.7 | 65.1 | 53.6 | 11.5 | 94.3 |
| Dell OptiPlex 3070 Small Form Factor Compare | 40.1 | 36.7 | 58.9 | 97 | 53.6 | 69.9 | 89.5 |
| ASUS NUC 15 Pro RNUC15CRKU50000U Compare | 64.2 | 65.9 | 99.2 | 76.4 | 4.3 | 37.1 | 76.1 |
| Lenovo ThinkCentre M70q Compare | 45 | 36.7 | 45.9 | 68.7 | 18.7 | 69.9 | 87.4 |
| MSI Cubi NUC 1MG-295US Compare | 36.1 | 36.7 | 51.3 | 76.4 | 35.7 | 37.1 | 96.4 |
Prix
Rapport qualité-prix
À partir de 175 $CA
Amazon 1 offre À partir de 175 $CA
Historique des prix
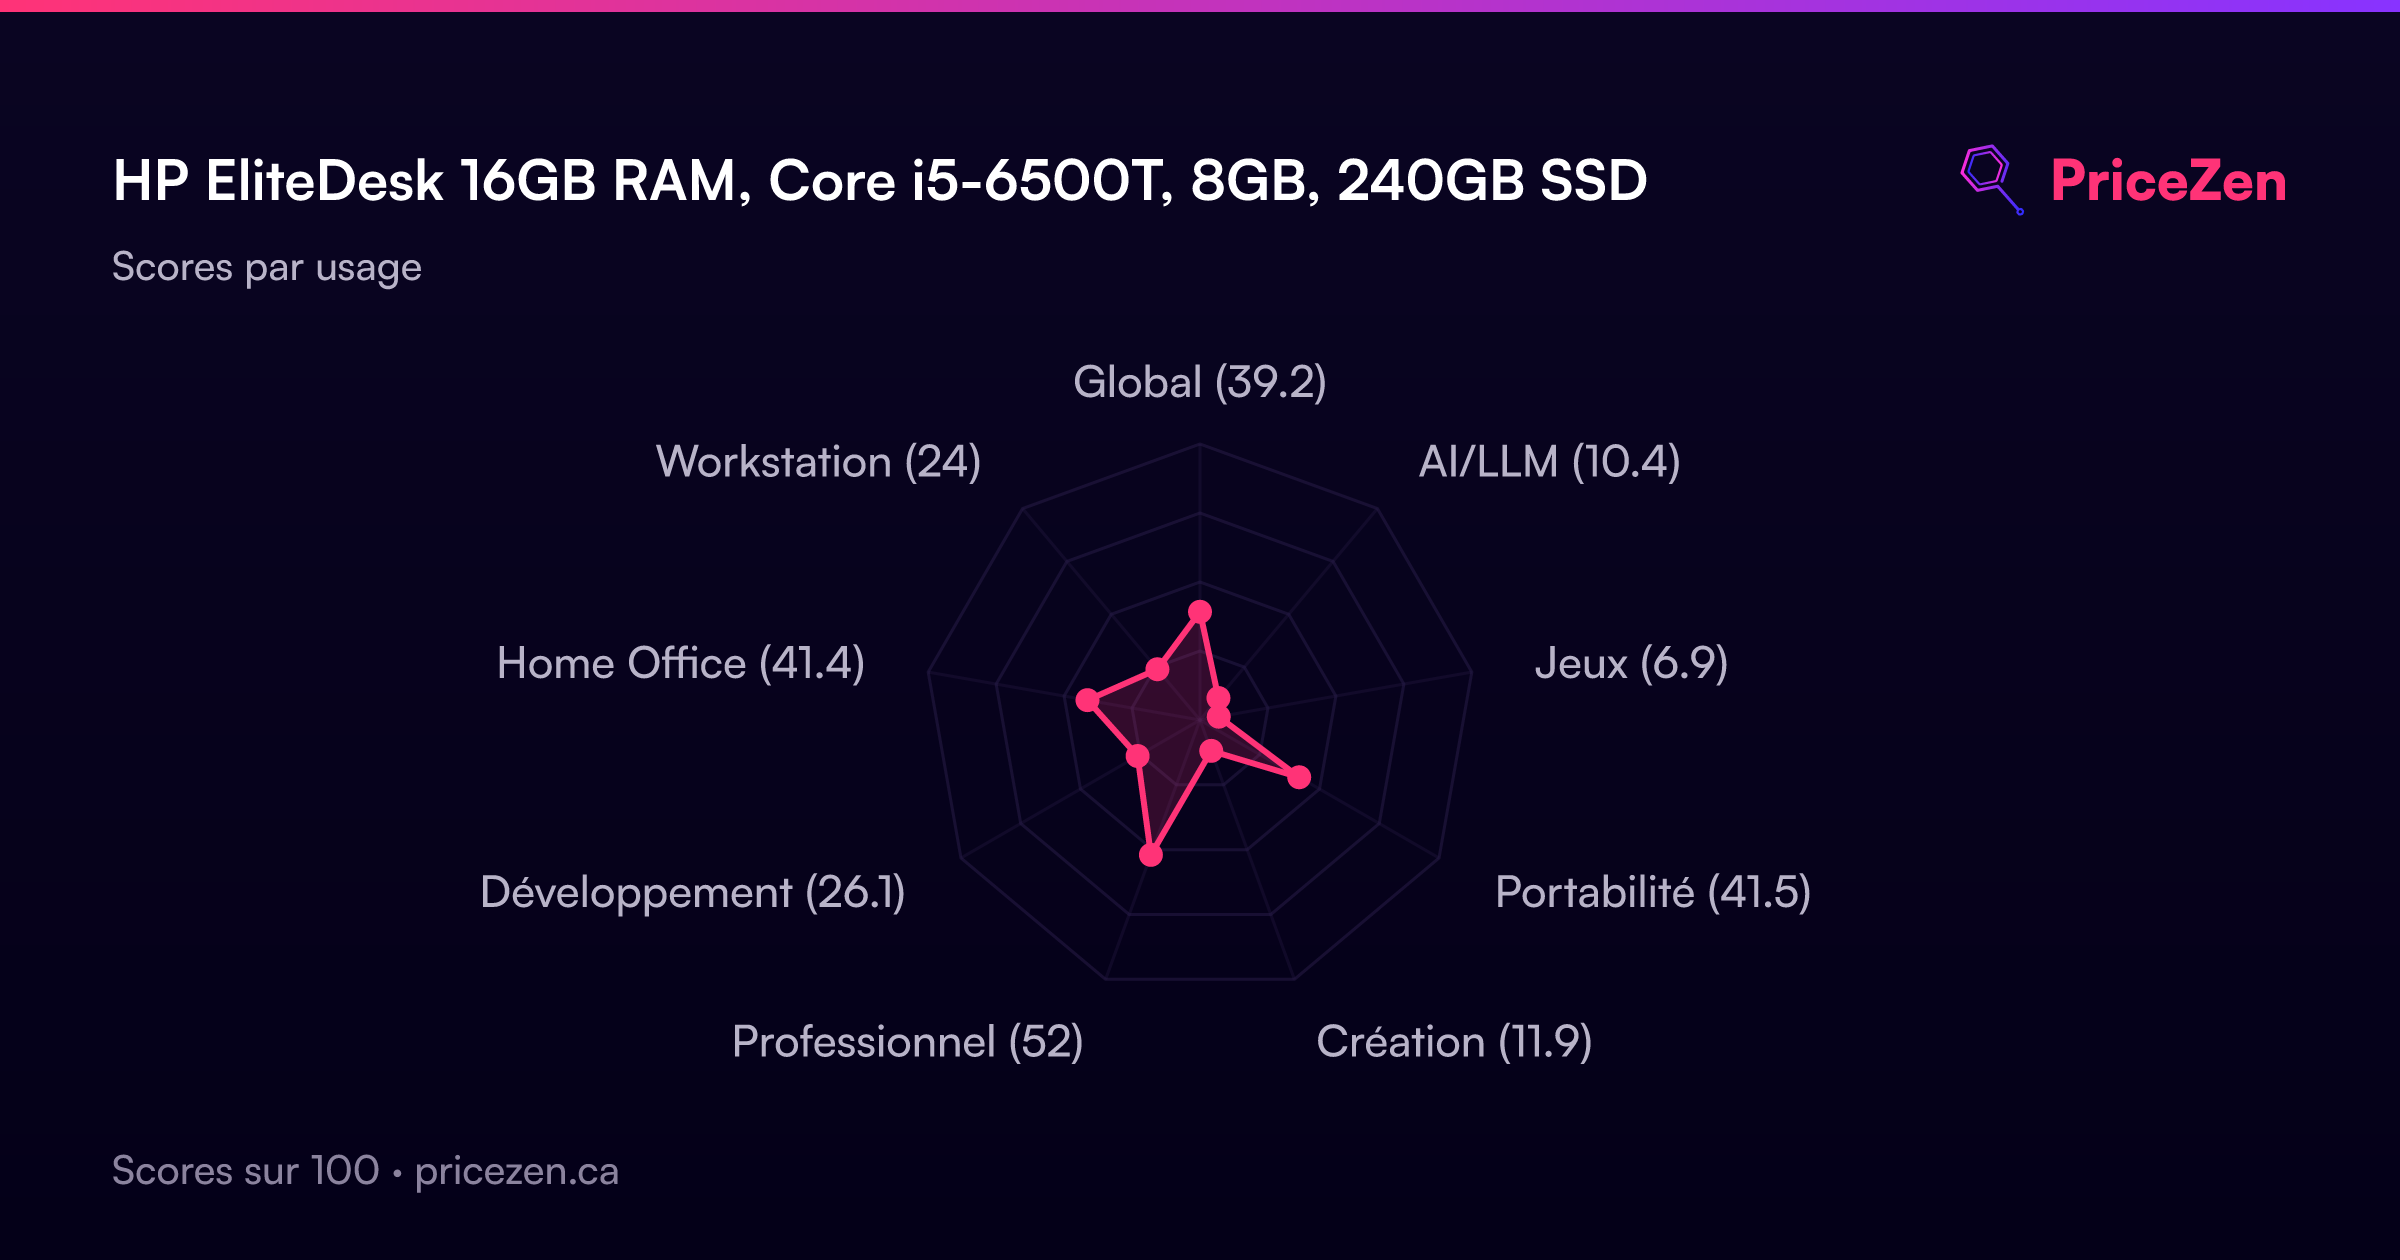
Scores par usage
- Global39.2
- AI/LLM10.4
- Jeux6.9
- Portabilité41.5
- Création11.9
- Professionnel52
- Développement26.1
- Home Office41.4
- Workstation24
Un test complet arrive bientôt. Les caractéristiques, scores, prix et graphiques ci-dessus sont toujours à jour.