Lenovo All-in-One 24", Intel N100, 16GB, 256GB SSD + 512GB SSD, Cloud Gray
CPU Intel Processor N100
RAM 16 GB
Storage 768 GB
GPU Integrated Intel UHD Graphics
Form Factor aio
psu w 65
OS Windows 11 Pro

43 Score global
Aucun prix actuel chez les marchands


Aperçu
Avantages et inconvénients
Points forts
- Strong reliability (70th percentile) 70th
Points faibles
- Below average cpu (12th percentile)
- Below average ram (31st percentile)
- Below average port selection (34th percentile)
Les preuves
Performances
Caractéristiques techniques
Fiche technique complète
Processor
| CPU | Intel Processor N100 |
| Cores | 4 |
| Frequency | 700 MHz |
| L3 Cache | 6 MB |
Graphics
| GPU | Integrated Intel UHD Graphics |
| Type | Integrated |
| VRAM Type | Shared |
Memory & Storage
| RAM | 16 GB |
| RAM Generation | DDR4 |
| Storage 1 | 256 GB |
| Storage 1 Type | SSD |
| Storage 2 | 512 GB |
| Storage 2 Type | SSD |
Build
| Form Factor | aio |
| PSU | 65 |
Connectivity
| USB-C Ports | 0 |
| USB Ports | 4 |
| HDMI | ✓ |
| Wi-Fi | Wi-Fi 6 |
| Bluetooth | Bluetooth 5.2 |
| Ethernet | Gigabit Ethernet |
System
| OS | Windows 11 Pro |
Face à la concurrence
| Spec | Lenovo All-in-One 24" | Apple Mac Studio M5 Max | Dell Desktop ECT1250 | HP OMEN GT16-0364 | ASUS ROG GM700 | MSI Aegis ZS2 A9NVP-1407US |
|---|---|---|---|---|---|---|
| CPU | Intel Processor N100 | Apple M5 Max | Intel Core Ultra 7 265 | AMD Ryzen 7 8700F | AMD Ryzen 7 9800X3D | AMD Ryzen 9 9900X |
| RAM (GB) | 16 | 36 | 32 | 32 | 32 | 32 |
| Storage (GB) | 768 | 1024 | 2048 | 1024 | 2048 | 2048 |
| GPU | Integrated Intel UHD Graphics | Apple (32-Core) | Intel UHD Graphics | NVIDIA GeForce RTX 5070 | NVIDIA GeForce RTX 5070 Ti | NVIDIA GeForce RTX 5070 |
| Form Factor | aio | mini | sff | mid-tower | mid-tower | mid-tower |
| Psu W | 65 | 480 | 180 | 850 | 850 | 750 |
| OS | Windows 11 Pro | macOS | Windows 11 Home | Windows 11 Home | Windows 11 Home | Windows 11 Home |
| Compare | Compare | Compare | Compare | Compare |
| Produit | CPU | GPU | RAM | Connectique | Stockage | Fiabilité | Preuve sociale |
|---|---|---|---|---|---|---|---|
| Lenovo All-in-One 24" | 11.7 | 36.6 | 31.3 | 34.2 | 46.6 | 70 | 61.4 |
| Apple Mac Studio M5 Max Compare | 95.7 | 85.1 | 92.4 | 88.9 | 68.7 | 99.3 | 66.8 |
| Dell Desktop ECT1250 Compare | 88.2 | 60.2 | 81.7 | 74.6 | 82.6 | 70 | 98.2 |
| HP OMEN GT16-0364 Compare | 69.5 | 90.7 | 87.1 | 97.9 | 53.4 | 70 | 98.2 |
| ASUS ROG GM700 Compare | 80.4 | 94.6 | 81.7 | 96 | 90 | 37.3 | 99.2 |
| MSI Aegis ZS2 A9NVP-1407US Compare | 92.4 | 90.7 | 87.1 | 90.3 | 82.6 | 37.3 | 99.2 |
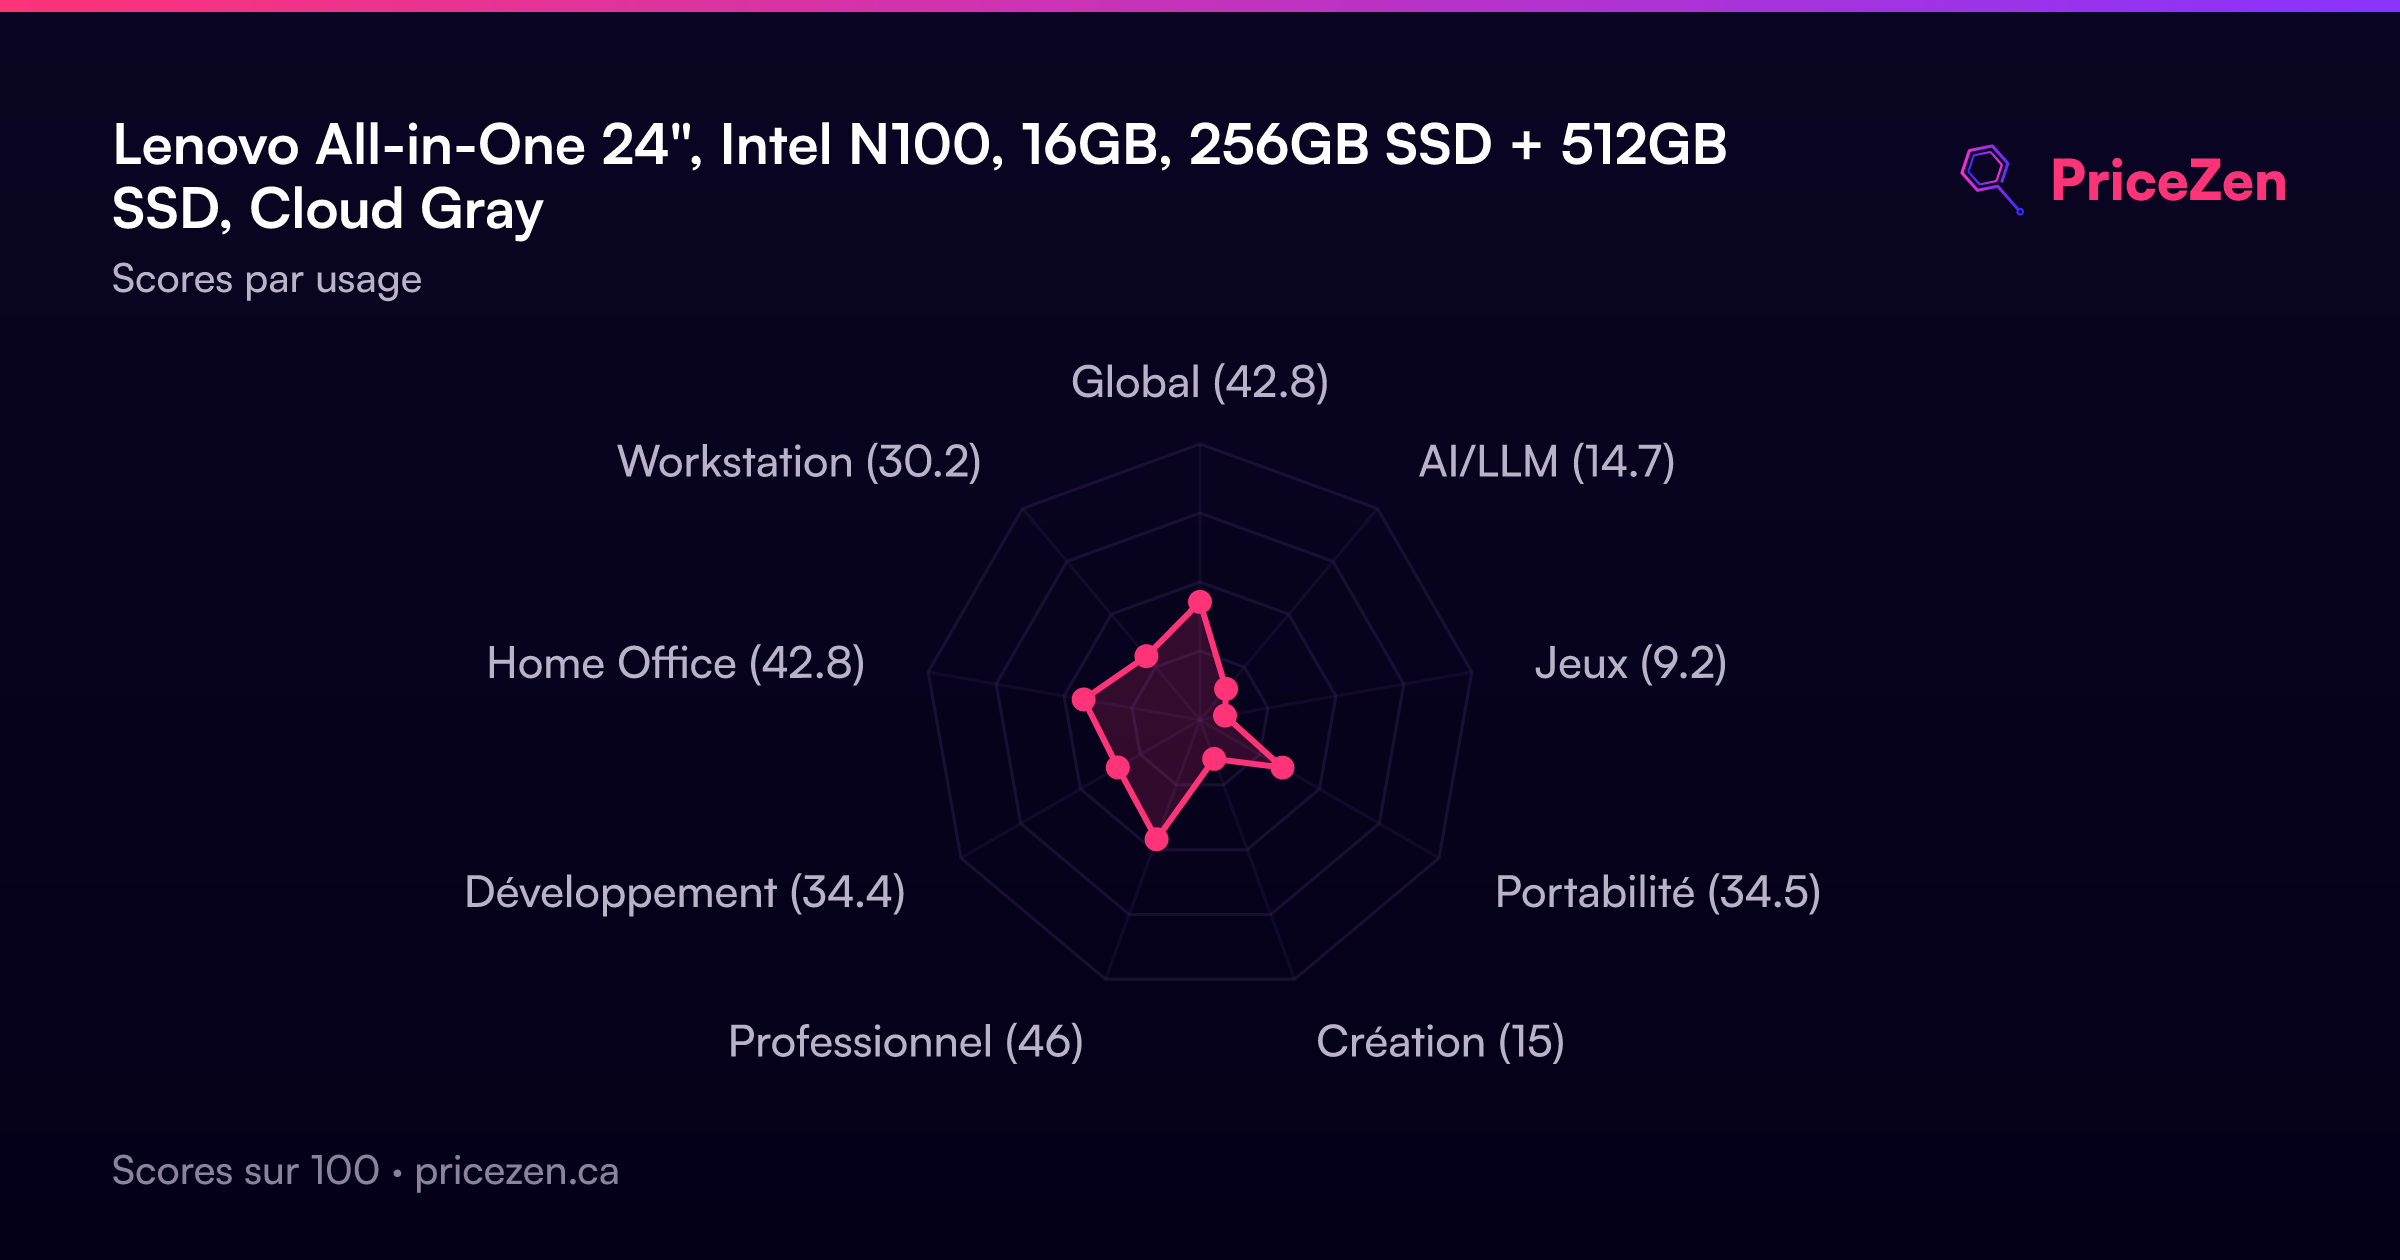
Scores par usage
- Global42.8
- AI/LLM14.7
- Jeux9.2
- Portabilité34.5
- Création15
- Professionnel46
- Développement34.4
- Home Office42.8
- Workstation30.2
Un test complet arrive bientôt. Les caractéristiques, scores, prix et graphiques ci-dessus sont toujours à jour.