ASUS NUC 13 Pro NUC13ANKi50WC, Core i5-1340P, 32GB, 512GB SSD, Silver
CPU Intel Core i5 1340P
RAM 32 GB
Storage 512 GB
GPU Intel Iris Xe Graphics
Form Factor mini
psu w 120
OS Windows 11 Pro

47 Score global
Aucun prix actuel chez les marchands
Aperçu
Avantages et inconvénients
Points forts
Points faibles
- Below average storage (29th percentile)
Les preuves
Performances
Caractéristiques techniques
Fiche technique complète
Processor
| CPU | Intel Core i5 1340P |
| Cores | 12 |
| Frequency | 1.9 GHz |
| L3 Cache | 12 MB |
Graphics
| GPU | Intel Iris Xe Graphics |
| Type | Integrated |
| VRAM Type | Shared |
Memory & Storage
| RAM | 32 GB |
| RAM Generation | DDR4 |
| Storage | 512 GB |
| Storage Type | SSD |
Build
| Form Factor | mini |
| PSU | 120 |
Connectivity
| USB Ports | 5 |
| Thunderbolt | Thunderbolt 4 |
| HDMI | dual HDMI 2.1 |
| Wi-Fi | Wi-Fi 6E |
| Bluetooth | Bluetooth 5.3 |
| Ethernet | 2.5Gbps Ethernet |
System
| OS | Windows 11 Pro |
Face à la concurrence
| Spec | ASUS NUC 13 Pro NUC13ANKi50WC | Apple Mac Studio M5 Max | Lenovo T Series Towers Legion Tower 5a Gen 10 | Dell Desktop ECT1250 | HP OMEN GT16-0364 | MSI Aegis ZS2 A9NVP-1407US |
|---|---|---|---|---|---|---|
| CPU | Intel Core i5 1340P | Apple M5 Max | AMD Ryzen 7 7800X3D | Intel Core Ultra 7 265 | AMD Ryzen 7 8700F | AMD Ryzen 9 9900X |
| RAM (GB) | 32 | 36 | 32 | 32 | 32 | 32 |
| Storage (GB) | 512 | 1024 | 4096 | 2048 | 1024 | 2048 |
| GPU | Intel Iris Xe Graphics | Apple (32-Core) | NVIDIA GeForce RTX 5070 Ti | Intel UHD Graphics | NVIDIA GeForce RTX 5070 | NVIDIA GeForce RTX 5070 |
| Form Factor | mini | mini | mid-tower | sff | mid-tower | mid-tower |
| Psu W | 120 | 480 | 850 | 180 | 850 | 750 |
| OS | Windows 11 Pro | macOS | Windows 11 Home | Windows 11 Home | Windows 11 Home | Windows 11 Home |
| Compare | Compare | Compare | Compare | Compare |
| Produit | CPU | GPU | RAM | Connectique | Stockage | Fiabilité |
|---|---|---|---|---|---|---|
| ASUS NUC 13 Pro NUC13ANKi50WC | 47.9 | 50.1 | 63.8 | 51.2 | 29.2 | 37.5 |
| Apple Mac Studio M5 Max Compare | 95.7 | 85 | 92.5 | 89.1 | 68.7 | 99.3 |
| Lenovo T Series Towers Legion Tower 5a Gen 10 Compare | 73.3 | 94.6 | 78 | 88.6 | 98.1 | 70.1 |
| Dell Desktop ECT1250 Compare | 88.1 | 60.2 | 81.6 | 75 | 82.6 | 70.1 |
| HP OMEN GT16-0364 Compare | 69.4 | 90.7 | 87.1 | 97.9 | 53.4 | 70.1 |
| MSI Aegis ZS2 A9NVP-1407US Compare | 92.4 | 90.7 | 87.1 | 90.4 | 82.6 | 37.5 |
Prix
Rapport qualité-prix
Nous suivons les prix de ce produit depuis le 29 mai 2026. Le graphique apparaîtra dès que nous aurons plus de données.
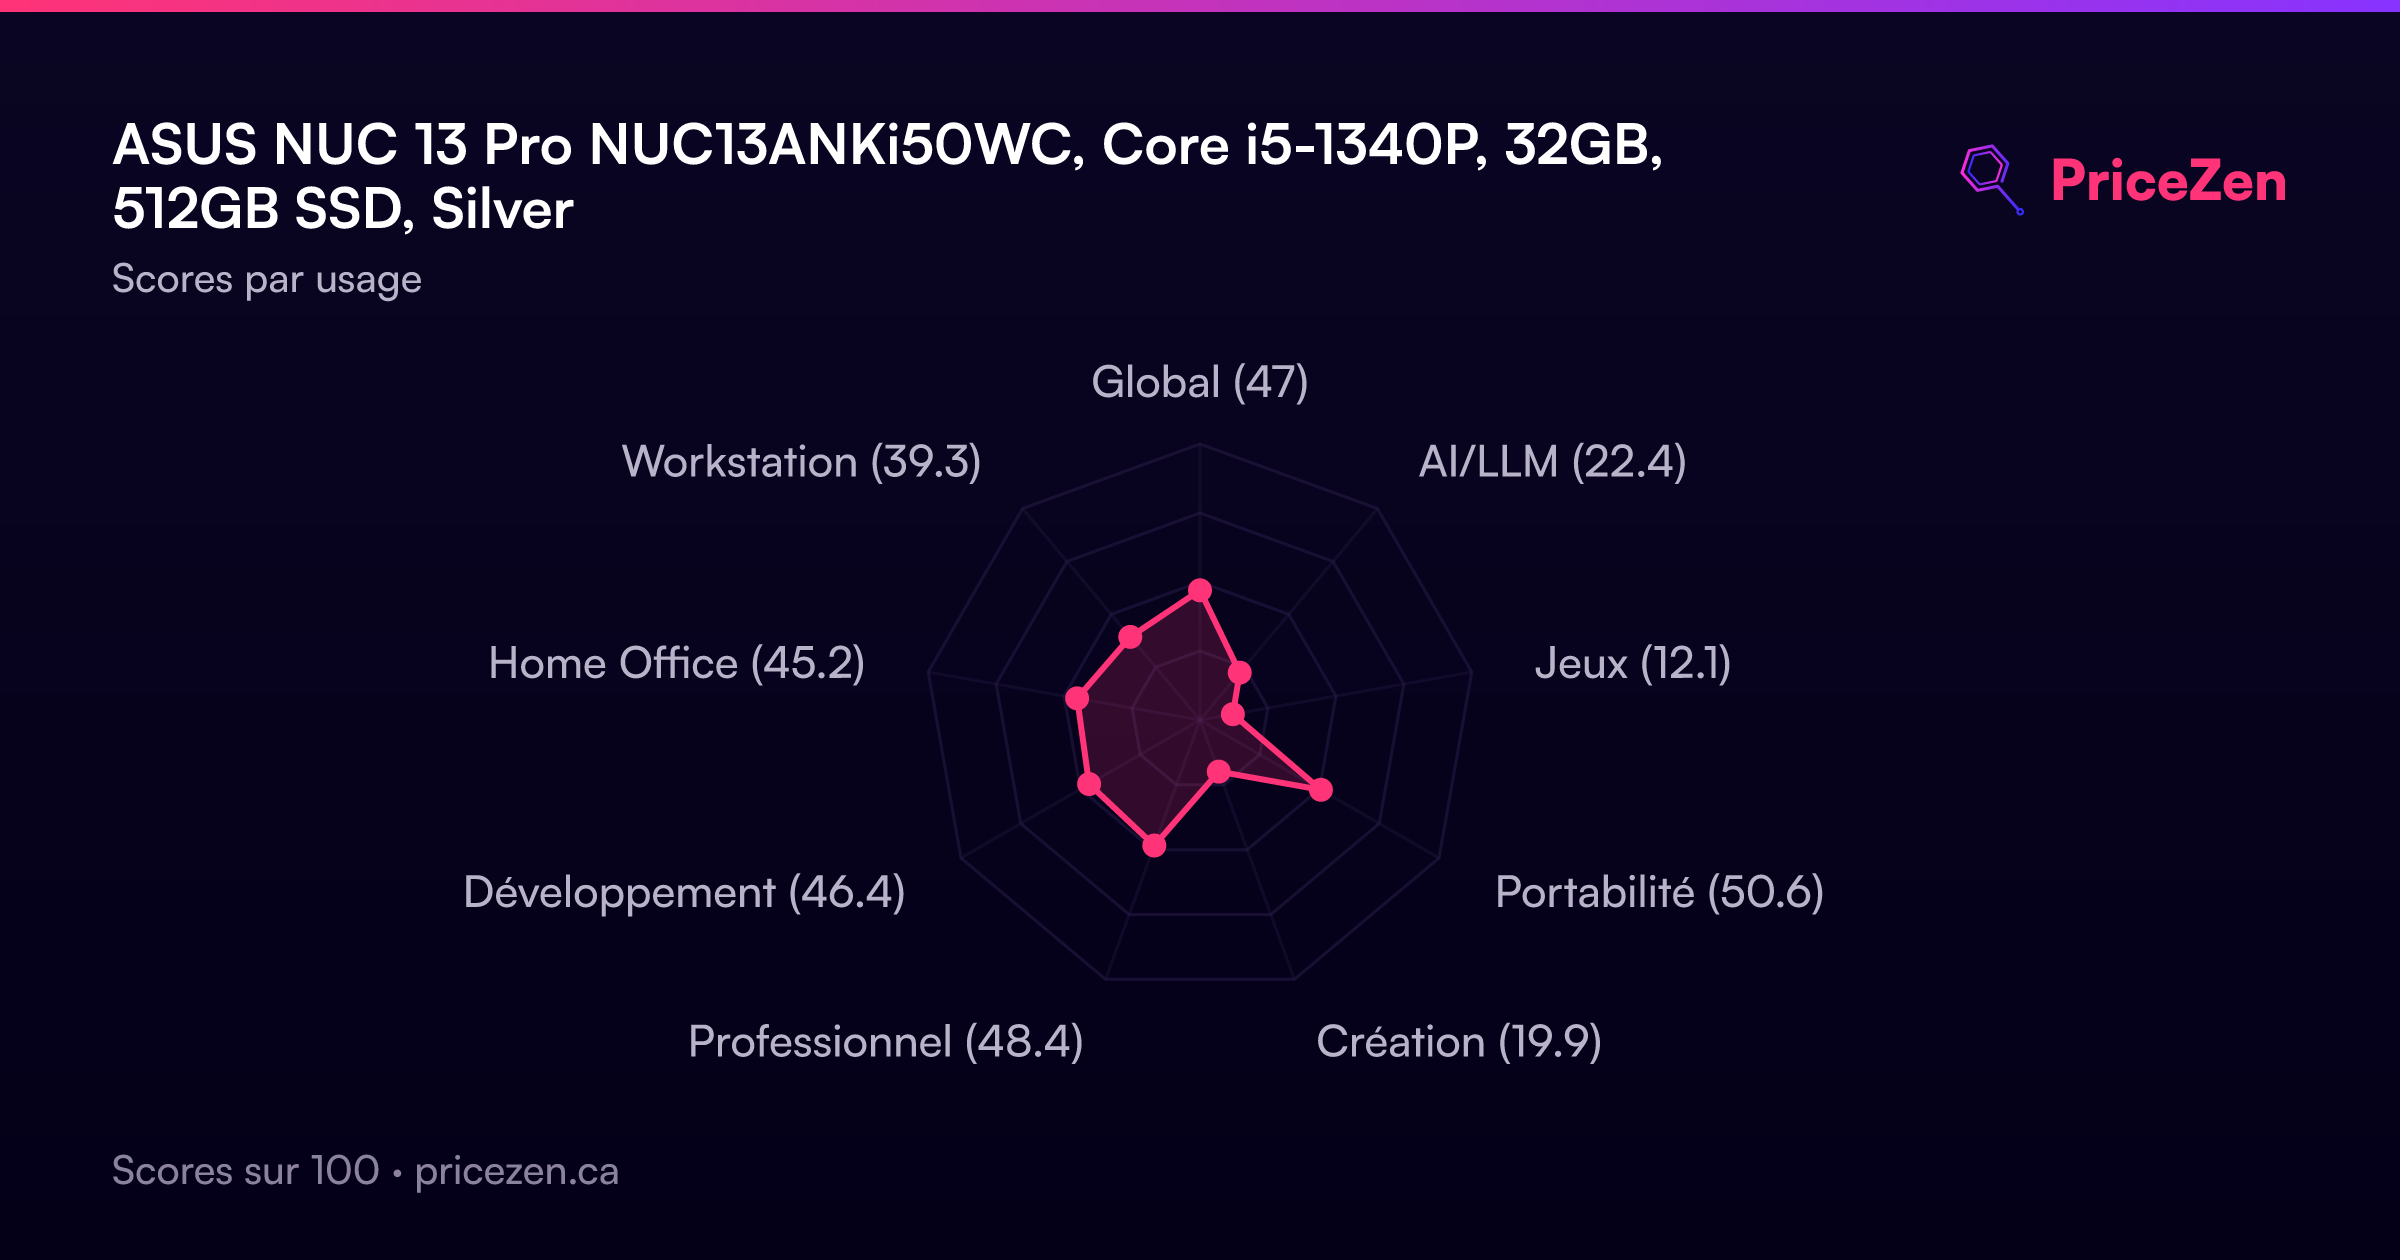
Scores par usage
- Global47
- AI/LLM22.4
- Jeux12.1
- Portabilité50.6
- Création19.9
- Professionnel48.4
- Développement46.4
- Home Office45.2
- Workstation39.3
Un test complet arrive bientôt. Les caractéristiques, scores, prix et graphiques ci-dessus sont toujours à jour.
Autres configurations20
NUC 13 Pro RNUC13ANHI30000UIIntel Core i3 1315U64GBBlack501 $CANUC 13 Pro RNUC13ANHH50000UIIntel Core i5 13420H64GBNegro665 $CANUC 13 Pro NUC13ANHi5Intel Core i5 1340PBlack750 $CANUC 13 ProIntel Core i5 13420H16GB1TBBlack810 $CANUC 13 Pro RNUC13ANKI3048CUIIntel Core i3 1315U8GB512GB856 $CANUC 13 Pro RNUC13L3KV50000UIIntel Core i5 1350PSchwarz893 $CANUC 13 Pro RNUC13ANKH5068CUIIntel Core i5 13420H16GB512GBBlack899 $CANUC 13 Pro RNUC13L3HV50000UIIntel Core i5 1350P969 $CANUC 13 Pro NUC13L3HV7Intel Core i7 1370P1 069 $CA
Afficher les 20 configurations
NUC 13 Pro RNUC13L3KV70000UIIntel Core i7 1370P64GBBlack1 115 $CANUC 13 ProIntel Core i7 1360P16GB500GB1 300 $CANUC 13 ProIntel Core i7 1360P32GB1TBBlack1 349 $CANUC 13 Pro NUC13ANKH7Intel Core i7 13620H32GB1TB1 599 $CANUC 13 Pro RNUC13ANKH70000UIIntel Core i7 13620H64GBBlackNUC 13 ProIntel Core i5 1340P16GB512GBNUC 13 Pro NUC13VYKi5Intel Core i5 1340P32GB1TBSilverNUC 13 Pro NUC13VYKi5Intel Core i5 1340P32GB512GBNUC 13 Pro NUC13ANKi50WCIntel Core i5 1340P32GB512GBSilverNUC 13 ProIntel Core i5 13420H16GB1280GBBlackNUC 13 PRO RNUC13ANKI70000UIi7-1360P