HP ProDesk 600 G5 SFF 2019, Core i5-9500, 16GB, 512GB SSD, Black
CPU Intel Core i5 9500
RAM 16 GB
Storage 512 GB
GPU Intel UHD Graphics 630
Form Factor sff
OS Windows 11 Pro

57 Score global
Aucun prix actuel chez les marchands


Aperçu
Avantages et inconvénients
Points forts
- Strong port selection (90th percentile) 90th
- Strong reliability (70th percentile) 70th
Points faibles
- Below average storage (29th percentile)
- Below average ram (31st percentile)
- Below average cpu (32nd percentile)
Les preuves
Performances
Caractéristiques techniques
Fiche technique complète
Processor
| CPU | Intel Core i5 9500 |
| Cores | 6 |
| Frequency | 3.0 GHz |
| L3 Cache | 9 MB |
Graphics
| GPU | Intel UHD Graphics 630 |
| Type | Integrated |
| VRAM Type | Shared |
Memory & Storage
| RAM | 16 GB |
| RAM Generation | DDR4 |
| Storage | 512 GB |
| Storage Type | SSD |
Build
| Form Factor | sff |
| Weight | 4.5 kg / 10.0 lbs |
Connectivity
| USB-C Ports | 1 |
| USB Ports | 10 |
| HDMI | 1x HDMI |
| DisplayPort | 2x DisplayPort |
| Bluetooth | ✓ |
| Ethernet | 1x Ethernet |
System
| OS | Windows 11 Pro |
Face à la concurrence
| Spec | HP ProDesk 600 G5 SFF | Apple Mac Studio M3 Ultra | Dell Desktop ECT1250 | MSI Aegis Z2 A8NVL-1610US | iBUYPOWER Slate MESH SMI7N4601 | Lenovo Yoga AIO F0J20012US |
|---|---|---|---|---|---|---|
| CPU | Intel Core i5 9500 | Apple M3 Ultra | Intel Core Ultra 7 265 | AMD Ryzen 7 8700F | Intel Core i7 14700F | Intel Core Ultra 7 255H |
| RAM (GB) | 16 | 96 | 32 | 16 | 32 | 16 |
| Storage (GB) | 512 | 1024 | 2048 | 3072 | 1024 | 2048 |
| GPU | Intel UHD Graphics 630 | Apple M3 Ultra 60-core | Intel UHD Graphics | NVIDIA GeForce RTX 5060 | NVIDIA GeForce RTX 4060 | Intel Arc Graphics |
| Form Factor | sff | sff | sff | mid-tower | mid-tower | aio |
| Psu W | - | - | 180 | 650 | 600 | 170 |
| OS | Windows 11 Pro | macOS | Windows 11 Home | Windows 11 Home | Windows 11 Home | Windows 11 Home |
| Compare | Compare | Compare | Compare | Compare |
| Produit | CPU | GPU | RAM | Connectique | Stockage | Fiabilité |
|---|---|---|---|---|---|---|
| HP ProDesk 600 G5 SFF | 31.6 | 36.6 | 31.3 | 90.3 | 29.2 | 70 |
| Apple Mac Studio M3 Ultra Compare | 99.7 | 77.5 | 95.7 | 93.5 | 53.4 | 99.3 |
| Dell Desktop ECT1250 Compare | 88.2 | 60.2 | 81.6 | 74.5 | 82.7 | 70 |
| MSI Aegis Z2 A8NVL-1610US Compare | 69.5 | 79.6 | 56.5 | 90.3 | 96.4 | 37.3 |
| iBUYPOWER Slate MESH SMI7N4601 Compare | 84.4 | 75.4 | 77.9 | 95.5 | 68.8 | 27.1 |
| Lenovo Yoga AIO F0J20012US Compare | 70.3 | 60.2 | 57.5 | 60.5 | 82.7 | 70 |
Prix
Rapport qualité-prix
Nous suivons les prix de ce produit depuis le 17 mai 2026. Le graphique apparaîtra dès que nous aurons plus de données.
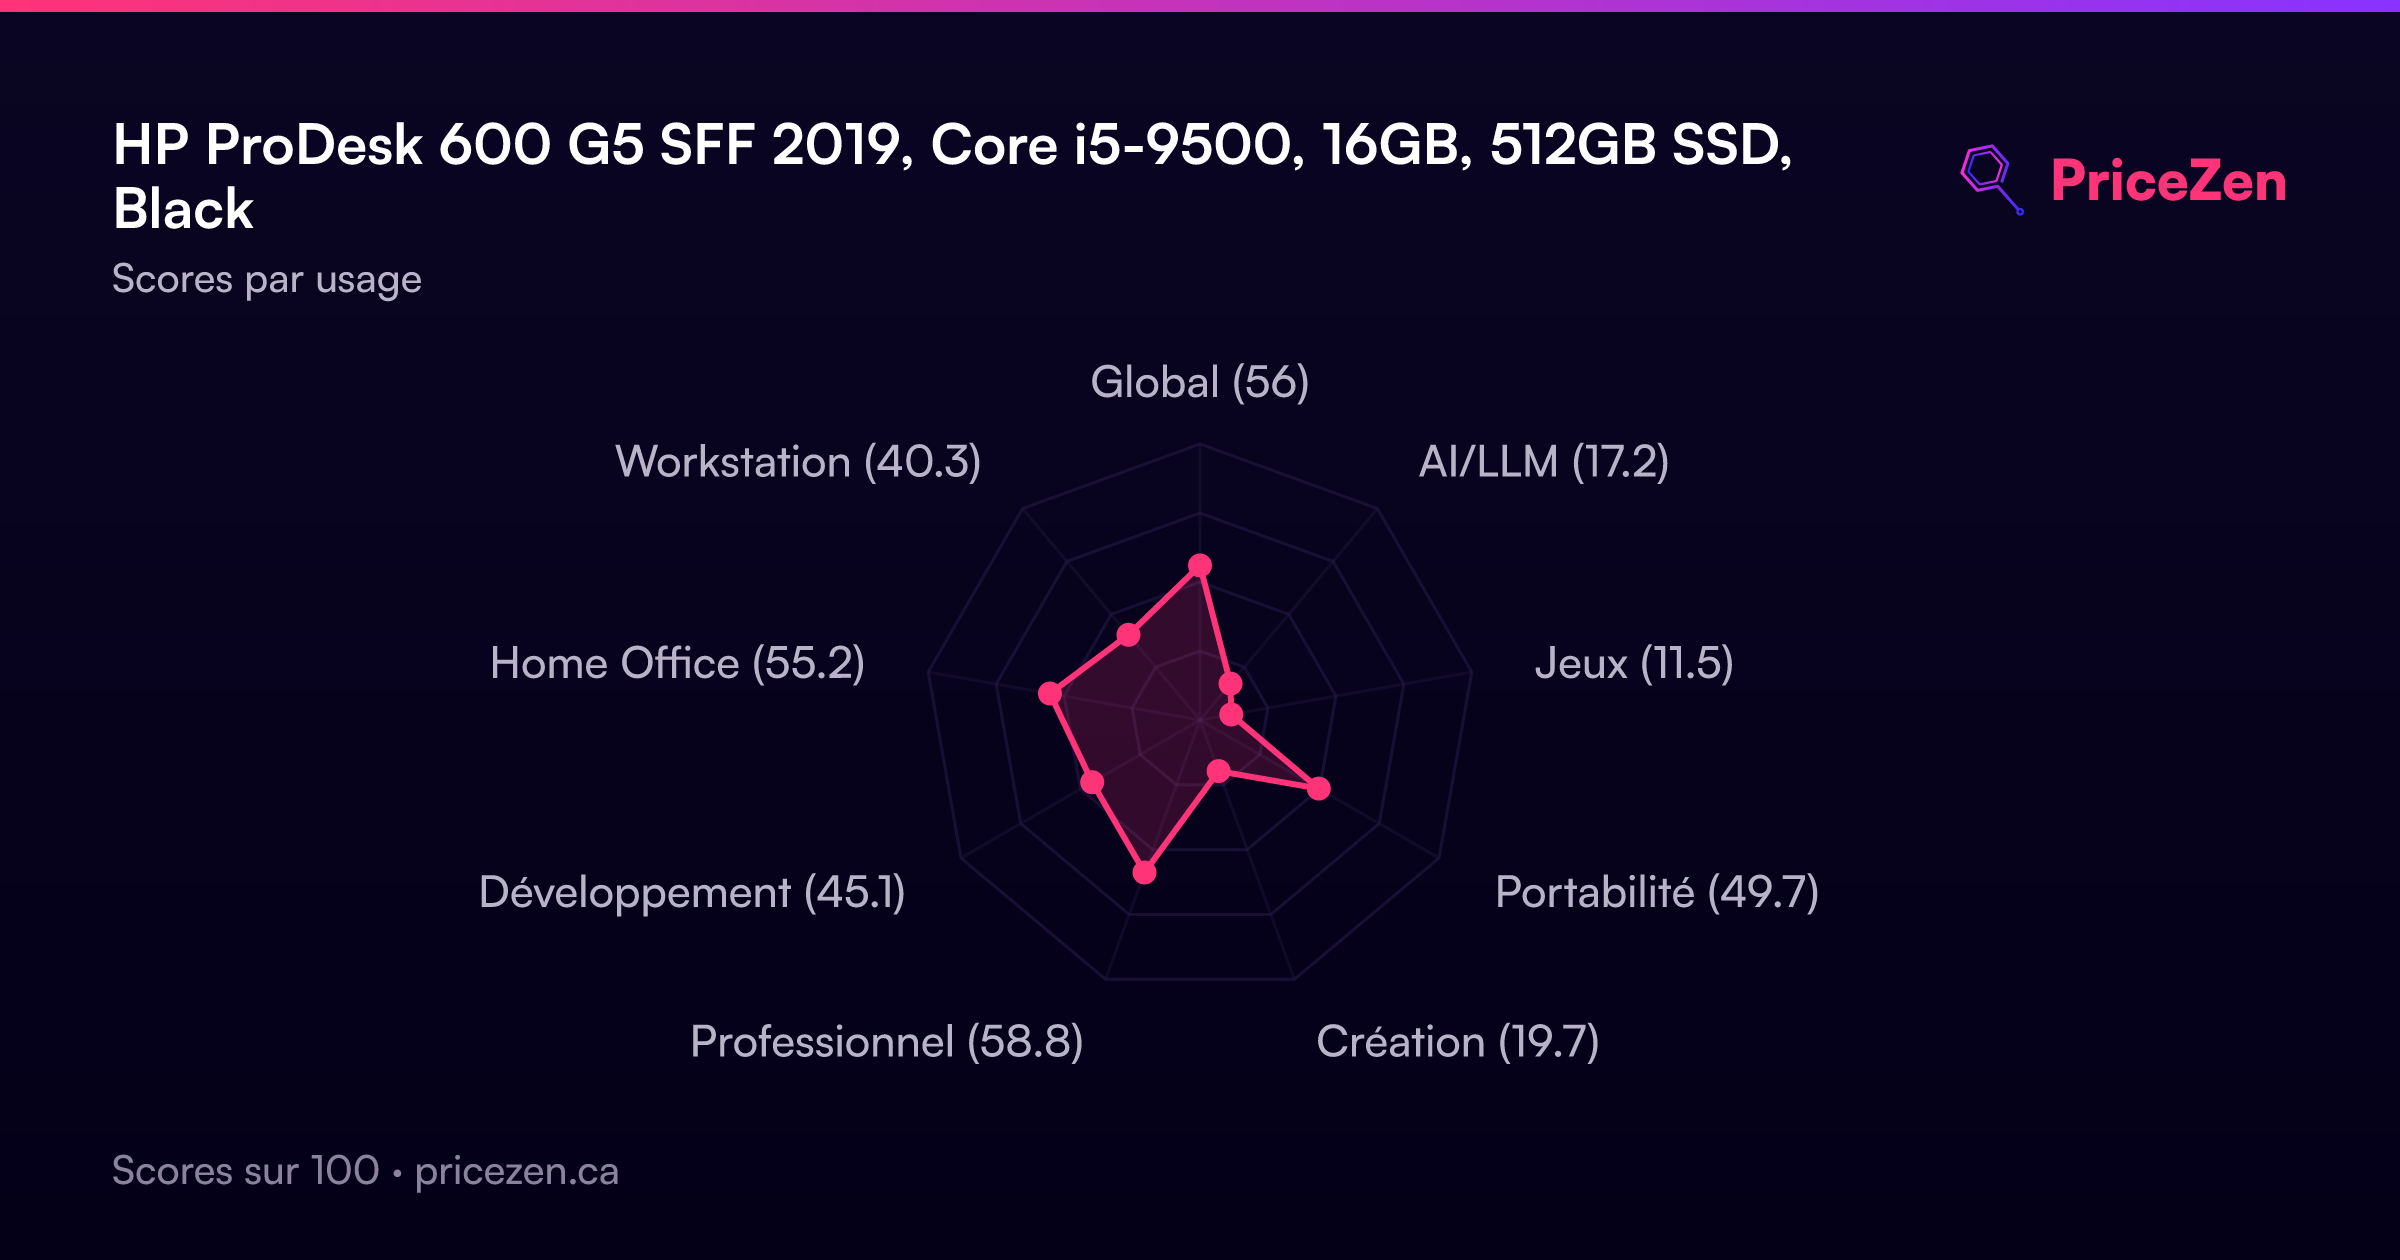
Scores par usage
- Global56.5
- AI/LLM17.2
- Jeux11.5
- Portabilité59
- Création19.7
- Professionnel58.8
- Développement45.1
- Home Office55.2
- Workstation40.3
Un test complet arrive bientôt. Les caractéristiques, scores, prix et graphiques ci-dessus sont toujours à jour.
Autres configurations23
ProDesk 600 G5 SFFI5-95008GB256GBBlack340 $CAProDesk 600 G5Intel Core i5 950016GB256GBBlack385 $CAProDesk 600 G5 SFFIntel Core i5 950016GB1280GBBlack399 $CAProDesk 600 G5Intel Core i5 950016GB512GBBlack440 $CAProDesk 600 G5i5-950016GB1TBBlack490 $CAProDesk 600 G5Intel Core i7-970016GB256GB560 $CAProDesk 600 G5-SFFIntel Core i7-970016GB500GBBlack590 $CAProDesk 600 G5 SFFIntel Core i5 950016GB2TBBlack/Silver670 $CAProDesk 600 G5 SFFIntel Core i5 950032GB2TBBlack/Silver790 $CA
Afficher les 23 configurations
ProDesk 600 G5Intel Core i5 950016GB500GBBlackProDesk 600 G5 SFFIntel Core i7 970016GB512GBBlackProDesk 600 G5Intel Core i5 950032GB1TBBlack/SilverProDesk 600 G5Intel Core i7 970032GB1TBProDesk 600 G5 SFFIntel Core i5 950016GB1TBBlackProDesk 600 G5 SFFIntel Core i7 970032GB1TBBlackProDesk 600 G5 SFFIntel Core i7 970032GB512GBBlackProDesk 600 G5Intel Core i5 95008GB256GBBlack/SilverProDesk 600 G5Intel Core i7-970016GB1TBBlackProDesk 600 G5 SFFIntel Core i7 970016GB1TBBlackProDesk 600 G5 SFFIntel Core i5 95008GB1152GBBlackProDesk 600 G5 SFFIntel Core i7 970016GB256GBBlackProDesk 600 G5 SFFIntel Core i5 95008GB256GBBlackProDesk 600 G5 SFFIntel Core i5 95008GB512GBBlack