New
Seagate FireCuda 540 2TB PCIe 5.0 x4 NVMe M.2 2280
Capacity 2TB
Form Factor M.2 2280
Interface PCIe 5.0 x4
Read Speed 10,000 MB/s
NAND TLC
DRAM Cache Yes
Endurance 2000 TBW

80 Overall Score
No current retailer price


Snapshot
Pros & Cons
Pros
- Strong random (98th percentile) 98th
- Strong speed (96th percentile) 96th
- Strong endurance (94th percentile) 94th
- Strong feature (91st percentile) 91st
Cons
- Below average affordability (0th percentile)
The proof
Performance
Specifications
Full Specifications
Drive
| Capacity | 2000 |
| Form Factor | M.2 2280 |
| Interface | PCIe 5.0 x4 |
| Protocol | NVMe |
| PCIe Generation | 5 |
| External | No |
Performance
| Sequential Read (MB/s) | 10000 |
| Sequential Write (MB/s) | 10000 |
| Random Read (IOPS) | 1490000 |
| Random Write (IOPS) | 1500000 |
Hardware
| NAND | TLC |
| DRAM Cache | Yes |
| Controller | Phison E26 |
Reliability
| Endurance (TBW) | 2000 |
| Warranty (years) | 5 |
Features
| Heatsink | No |
vs Competition
| Spec | Seagate FireCuda 540 | Western Digital WD_BLACK SN8100 | Samsung 9100 PRO | Kingston FURY Renegade | Crucial T700 | Team Group MP44 |
|---|---|---|---|---|---|---|
| Capacity | 2TB | 4TB | 4TB | 4TB | 2TB | 4TB |
| Form Factor | M.2 2280 | M.2 2280 | M.2 2280 | M.2 2280 | M.2 2280 | M.2 2280 |
| Interface | PCIe 5.0 x4 | PCIe 5.0 x4 | PCIe 5.0 x4 | PCIe 4.0 x4 | PCIe 5.0 x4 | PCIe 4.0 x4 |
| Seq Read | 10,000 MB/s | 14,900 MB/s | 14,800 MB/s | 7,300 MB/s | 12,400 MB/s | 7,400 MB/s |
| Nand Type | TLC | TLC | TLC | TLC | TLC | TLC |
| Dram Cache | true | false | true | true | true | false |
| Endurance | 2000 TBW | 2400 TBW | 2400 TBW | 4000 TBW | 1200 TBW | 2000 TBW |
| Compare | Compare | Compare | Compare | Compare |
| Product | Speed | Random | Feature | Capacity | Endurance | Affordability |
|---|---|---|---|---|---|---|
| Seagate FireCuda 540 | 95.6 | 97.5 | 90.7 | 78.6 | 93.5 | 0 |
| Western Digital WD_BLACK SN8100 Compare | 99.7 | 99.6 | 85.8 | 92.5 | 80.3 | 8.3 |
| Samsung 9100 PRO Compare | 99.2 | 99.8 | 99.7 | 92.5 | 85.6 | 5 |
| Kingston FURY Renegade Compare | 93.3 | 94.4 | 93.9 | 92.5 | 94 | 10.7 |
| Crucial T700 Compare | 96.7 | 97.7 | 97.5 | 78.6 | 82.5 | 22.2 |
| Team Group MP44 Compare | 93.6 | 88.7 | 52.8 | 92.5 | 76.6 | 16.2 |
Price
Value & Pricing
We started tracking prices for this product on Nov 8, 2026. The chart appears once we have more data.
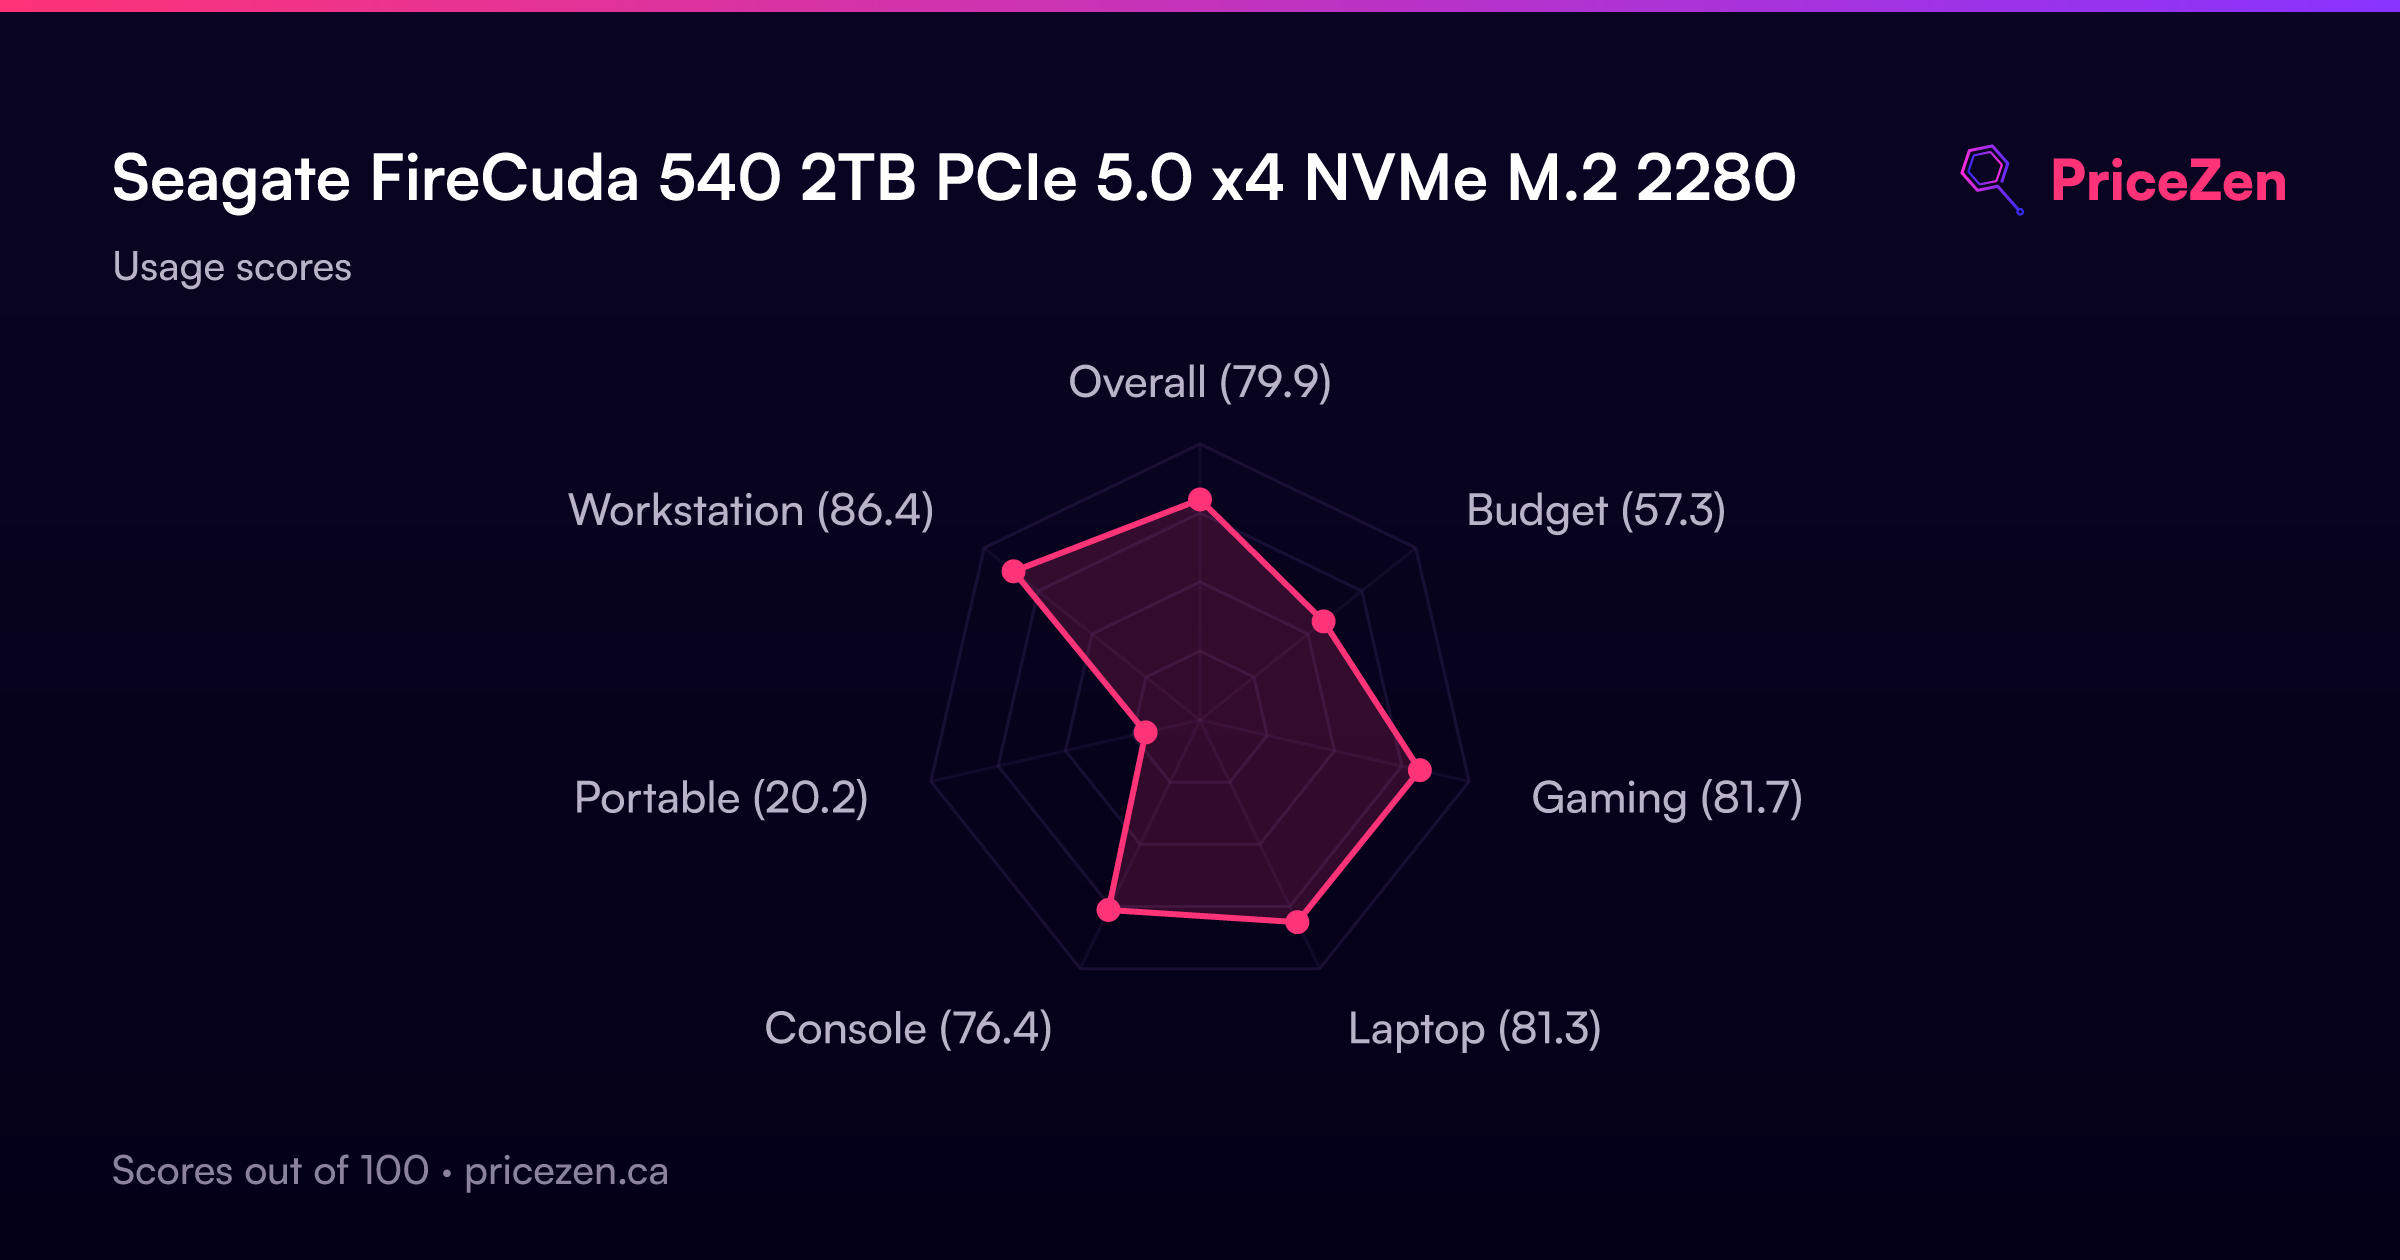
Usage Scores
- Overall80
- Budget57.2
- Gaming81.7
- Laptop81.3
- Console76.4
- Portable20.3
- Workstation86.2
A full written review is coming soon. The specs, scores, prices and charts above are always up to date.