Apple MacBook Air A2337 13 2020, M1, 16GB, 512GB SSD
CPU Apple M1
RAM 16 GB
Storage 512 GB
Screen 13"
GPU M1 GPU

45 Overall Score
No current retailer price
Snapshot
Pros & Cons
Pros
- Strong reliability (98th percentile) 98th
- Strong portability (91st percentile) 91st
Cons
- Below average port selection (13th percentile)
- Below average screen (20th percentile)
- Below average social proof (32nd percentile)
The proof
Performance
Specifications
Full Specifications
Processor
| CPU | Apple M1 |
| Cores | 8 |
Graphics
| Type | Integrated |
| VRAM Type | System Shared |
Memory & Storage
| RAM | 16 GB |
| Storage | 512 GB |
| Storage Type | SSD |
Display
| Size | 13" |
vs Competition
| Spec | Apple MacBook Air A2337 13 | Lenovo Legion 5i 15.1" 83F00008US | Samsung Galaxy Book5 Pro 14" NP944XHA-KG3US | ASUS Zenbook 14" UX3405CA-U9321TB | Dell Premium 14.5" LDA14250-7667SLV-PUS | HP OmniBook X Flip |
|---|---|---|---|---|---|---|
| CPU | Apple M1 | Intel Core Ultra 7 255HX | Intel Core Ultra 7 258V | Intel Core Ultra 9 285H | Intel Core Ultra 7 255H | AMD Ryzen AI 7 350 |
| RAM (GB) | 16 | 32 | 32 | 32 | 32 | 24 |
| Storage (GB) | 512 | 1024 | 1024 | 1024 | 1024 | 1024 |
| Screen | 13" | 15.1" 2560x1600 | 14" 2880x1800 | 14" 1920x1200 | 14.5" 3200x2000 | 14" 1920x1200 |
| GPU | M1 GPU | NVIDIA GeForce RTX 5060 | Intel Arc Graphics 140V | Intel Arc Graphics | Intel Arc Graphics | AMD Radeon 860M |
| OS | - | Windows 11 Home | Windows 11 Pro | Windows 11 Home | Windows 11 Home | Windows 11 Home |
| Weight (kg) | - | 2 | 1.2 | 1.3 | 1.7 | 1.4 |
| Battery (Wh) | - | 80 | 63 | 75 | 62 | 59 |
| Compare | Compare | Compare | Compare | Compare |
| Product | CPU | GPU | RAM | Ports | Screen | Portability | Storage | Reliability | Social Proof | Affordability |
|---|---|---|---|---|---|---|---|---|---|---|
| Apple MacBook Air A2337 13 | 47.5 | 61.7 | 36.3 | 13.1 | 19.8 | 91.1 | 35.9 | 98.1 | 32 | 63 |
| Lenovo Legion 5i 15.1" 83F00008US Compare | 94.4 | 88.4 | 86.4 | 97.2 | 94.3 | 56.5 | 79.4 | 81.8 | 89.2 | 26.8 |
| Samsung Galaxy Book5 Pro 14" NP944XHA-KG3US Compare | 65.8 | 69.7 | 79.6 | 83.2 | 91.6 | 89.4 | 79.4 | 81.8 | 98.4 | 20.1 |
| ASUS Zenbook 14" UX3405CA-U9321TB Compare | 90.2 | 69.7 | 89.8 | 57.8 | 82.4 | 87 | 65.3 | 60.4 | 98.4 | 16 |
| Dell Premium 14.5" LDA14250-7667SLV-PUS Compare | 87.1 | 69.7 | 89.1 | 66 | 97.2 | 61.1 | 65.3 | 33.5 | 98.4 | 13.9 |
| HP OmniBook X Flip Compare | 80.1 | 64.6 | 82.4 | 77.2 | 74 | 79.4 | 65.3 | 33.5 | 97.3 | 43.6 |
Price
Value & Pricing
We started tracking prices for this product on Jun 24, 2026. The chart appears once we have more data.
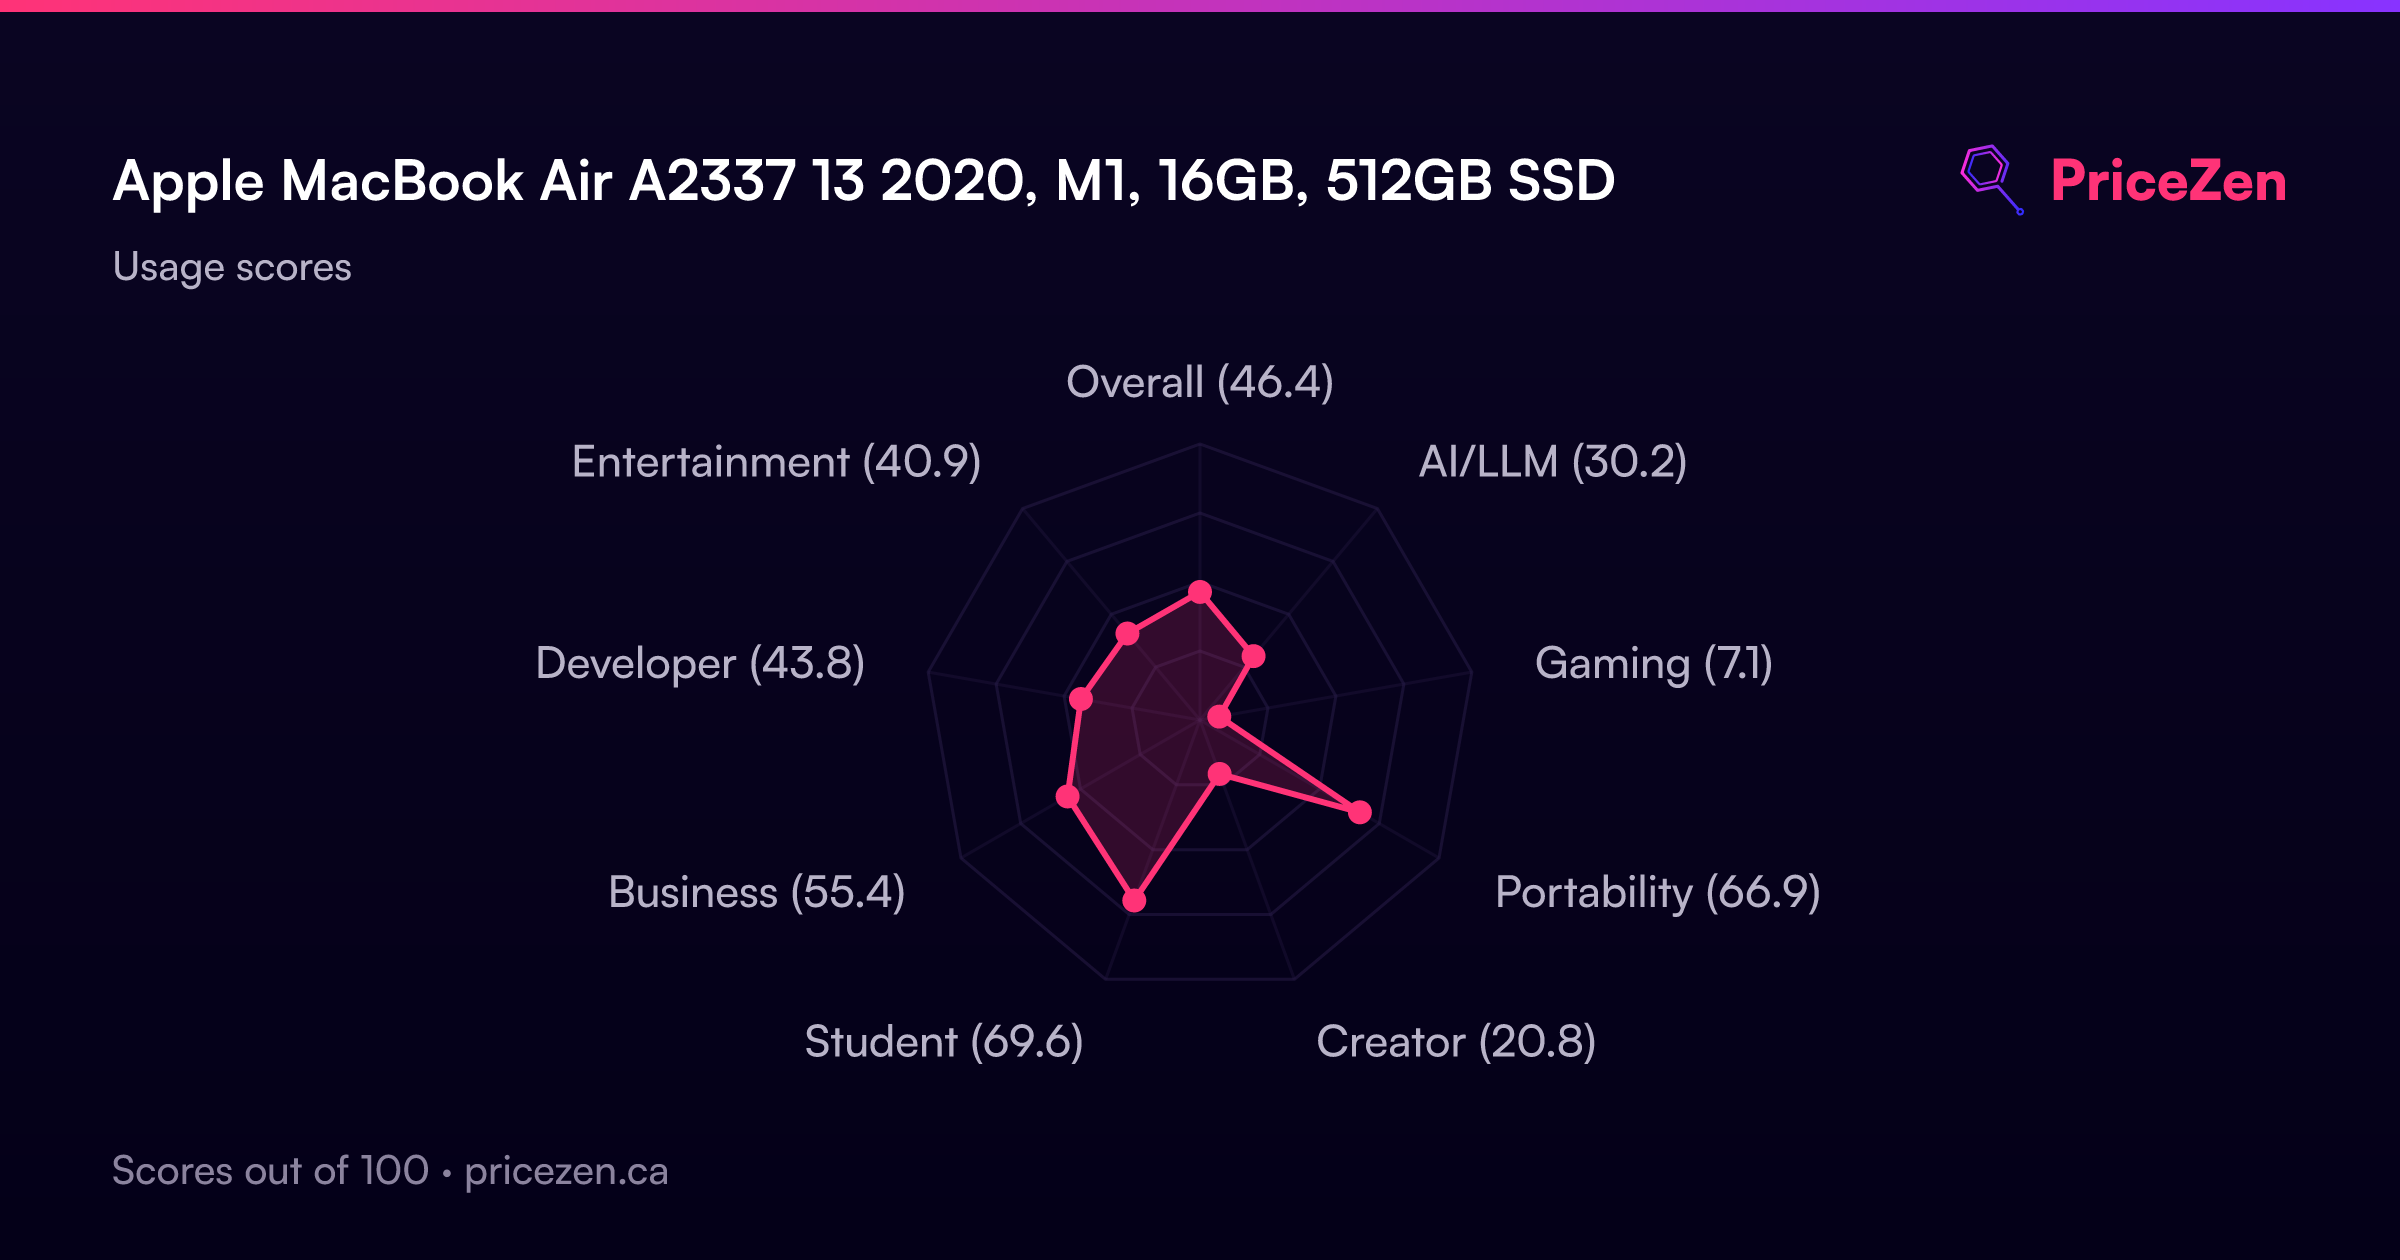
Usage Scores
- Overall45.2
- AI/LLM29.3
- Gaming7
- Portability65.2
- Creator20.4
- Student67.7
- Business52.7
- Developer42.5
- Entertainment39.1
A full written review is coming soon. The specs, scores, prices and charts above are always up to date.
Other Configurations20
MacBook Air 13.3" M1Apple M18GB256GBSpace GrayCA$667MacBook Air A Grade 13.3-inch 3.2Ghz 8-CoreApple M18GB256GBSilverCA$713MacBook Air A Grade 13.3-inch 3.2Ghz 8-CoreApple M18GB128GBSpace GrayCA$850MacBook Air A Grade 13.3-inch 3.2Ghz 8-CoreApple M18GB128GBSilverCA$900MacBook Air 13.3" M1Apple M18GB512GBSilverCA$1,200MacBook Air A Grade 13.3-inch 3.2Ghz 8-CoreApple M18GB256GBGoldMacBook Air 13.3" M1Apple M1 8GB512GBSpace GrayMacBook Air A Grade 13.3-inch 3.2Ghz 8-CoreApple M18GB512GBSpace GrayMacBook Air 13.3" M1Apple M1 8GB256GBGold
Show all 20 configurations
MacBook Air MGNF3LL/A 13.3"Apple M18GB128GBSpace GrayMacBook Air A Grade 13.3-inch 3.2Ghz 8-CoreApple M18GB256GBSpace GrayMacBook Air 13.3-inch M1 ChipApple M18GB256GBSpace GreyMacBook Air 2020 13.3" Laptop M1 ChipApple M116GB256GBGrayMacBook Air 13.3"Apple M1 8GB128GBSpace GreyMacBook Air 13.3" M1Apple M18GB128GBSpace GrayMacBook Air 13.3" M1 CPU @ 3.20GHzApple M1 8GB128GBSpace GrayMacBook Air 13.3" M1 8-Core CPU 7-Core GPUApple M18GB128GBSilverMacBook Air 13.3" MGN93LL/A-RBApple M18GB256GBSilverMacBook Air 13.3" M1 ChipApple M116GB1TBSpace GrayMacBook Air MGN63LL/A 2020 13.3-inchApple M1 16GB256GBSpace Gray