ASUS GeForce RTX 4070 Ti TUF Gaming 12GB GDDR6X
The Ada Lovelace architecture and 12GB of GDDR6X memory deliver strong 1440p gaming performance with a 26,912 PassMark score, while the TUF Gaming build provides a robust metal exoskeleton and military-grade capacitors for durability. Its 115W TDP keeps power draw and thermals in check without sacrificing the 2000MHz boost clock. This card is best for 1440p gamers who prioritize a quiet, cool, and physically tough GPU over chasing 4K extremes.

No current retailer price











Snapshot
Pros & Cons
Pros
- Strong raster (85th percentile) 85th
- Strong efficiency (75th percentile) 75th
- Strong rt (70th percentile) 70th
Cons
- Below average thermal (6th percentile)
- Below average social proof (7th percentile)
- Below average affordability (26th percentile)
- Below average connectivity (28th percentile)
What owners think
How owner sentiment changed over time
ExclusiveBased on when customers actually wrote their reviews - so you can see whether early praise held up.
4 written reviews, May 2024 – Jan 2026: 1 happy, 2 mixed, 1 unhappy
Across all 12 store ratings: 3.6★. Most owners rate without writing a review. The chart counts the 4 written reviews.
Each dot is one written review, in the month it was written. Happy = 4-5★, mixed = 3★, unhappy = 1-2★.
The proof
Performance
Specifications
Full Specifications
Chipset
| GPU Chipset | GeForce RTX 4070 Ti |
| Brand | NVIDIA |
| Architecture | Ada Lovelace |
| Class | consumer |
| Process | 5 |
Memory
| VRAM | 12 GB |
| Memory Type | GDDR6X |
| Memory Bus | 128 |
| Bandwidth | 480 |
Compute
| CUDA Cores | 4608 |
| Tensor Cores | 144 |
| RT Cores | 36 |
| Base Clock | 1230 |
| Boost Clock | 2000 |
| FP16 TFLOPS | 29.15 |
| FP32 TFLOPS | 29.15 |
Performance
| PassMark G3D | 31550 |
| GPU Compute | 14631 |
Power & Cooling
| TDP | 285 |
| Recommended PSU | 550 |
Connectivity
| Interface | PCI Express 4.0 x16 |
| DisplayPort | 1 |
| HDMI | 1 |
Physical
| Weight | 0.3 kg / 0.7 lbs |
Features
| Ray Tracing | Yes |
vs Competition
| Spec | ASUS GeForce RTX 4070 Ti TUF Gaming | Gigabyte GeForce RTX 5070 Ti Eagle Ice | MSI GeForce RTX 5070 Ti Ventus 3X OC | ZOTAC GeForce RTX 5080 APOCALYPSE | Sapphire Radeon RX 7900 XTX NITRO+ | PNY GeForce RTX 5080 ARGB OC |
|---|---|---|---|---|---|---|
| Chipset | GeForce RTX 4070 Ti | GeForce RTX 5070 Ti | GeForce RTX 5070 Ti | GeForce RTX 5080 | Radeon RX 7900 XTX | GeForce RTX 5080 |
| Vram | 12GB GDDR6X | 16GB GDDR7 | 16GB GDDR7 | 16GB GDDR7 | 24GB GDDR6 | 16GB GDDR7 |
| Boost Clock Mhz | 2000 | 2542 | 2482 | 2730 | 2680 | 2620 |
| Tdp W | 285 | 300 | 300 | 360 | 339 | 360 |
| Memory Bus Bits | 128 | 256 | 256 | 256 | 384 | 256 |
| Ray Tracing | true | true | true | true | true | true |
| GPU Class | consumer | consumer | consumer | consumer | consumer | consumer |
| Compare | Compare | Compare | Compare | Compare |
| Product | AI | Rt | Vram | Raster | Compute | Feature | Thermal | Efficiency | Connectivity | Social Proof | Affordability |
|---|---|---|---|---|---|---|---|---|---|---|---|
| ASUS GeForce RTX 4070 Ti TUF Gaming | 57.6 | 70 | 58.7 | 84.7 | 63.9 | 33.5 | 6.4 | 75 | 27.6 | 7 | 26.2 |
| Gigabyte GeForce RTX 5070 Ti Eagle Ice Compare | 79.5 | 88.7 | 86 | 89 | 88.1 | 95.9 | 91.8 | 72 | 94.1 | 93.3 | 26.9 |
| MSI GeForce RTX 5070 Ti Ventus 3X OC Compare | 79.5 | 92.5 | 86 | 89 | 88.1 | 95.9 | 91.8 | 72 | 94.1 | 83.8 | 23.4 |
| ZOTAC GeForce RTX 5080 APOCALYPSE Compare | 85.6 | 97.5 | 89 | 94.5 | 93.4 | 95.9 | 91.8 | 57 | 94.1 | 98.7 | 20.5 |
| Sapphire Radeon RX 7900 XTX NITRO+ Compare | 95.1 | 96.3 | 91.9 | 83.5 | 95.6 | 95.9 | 91.8 | 52 | 98.8 | 69 | 19 |
| PNY GeForce RTX 5080 ARGB OC Compare | 85.6 | 97.5 | 89 | 94.5 | 93.4 | 95.9 | 91.8 | 57 | 94.1 | 74.8 | 14.7 |
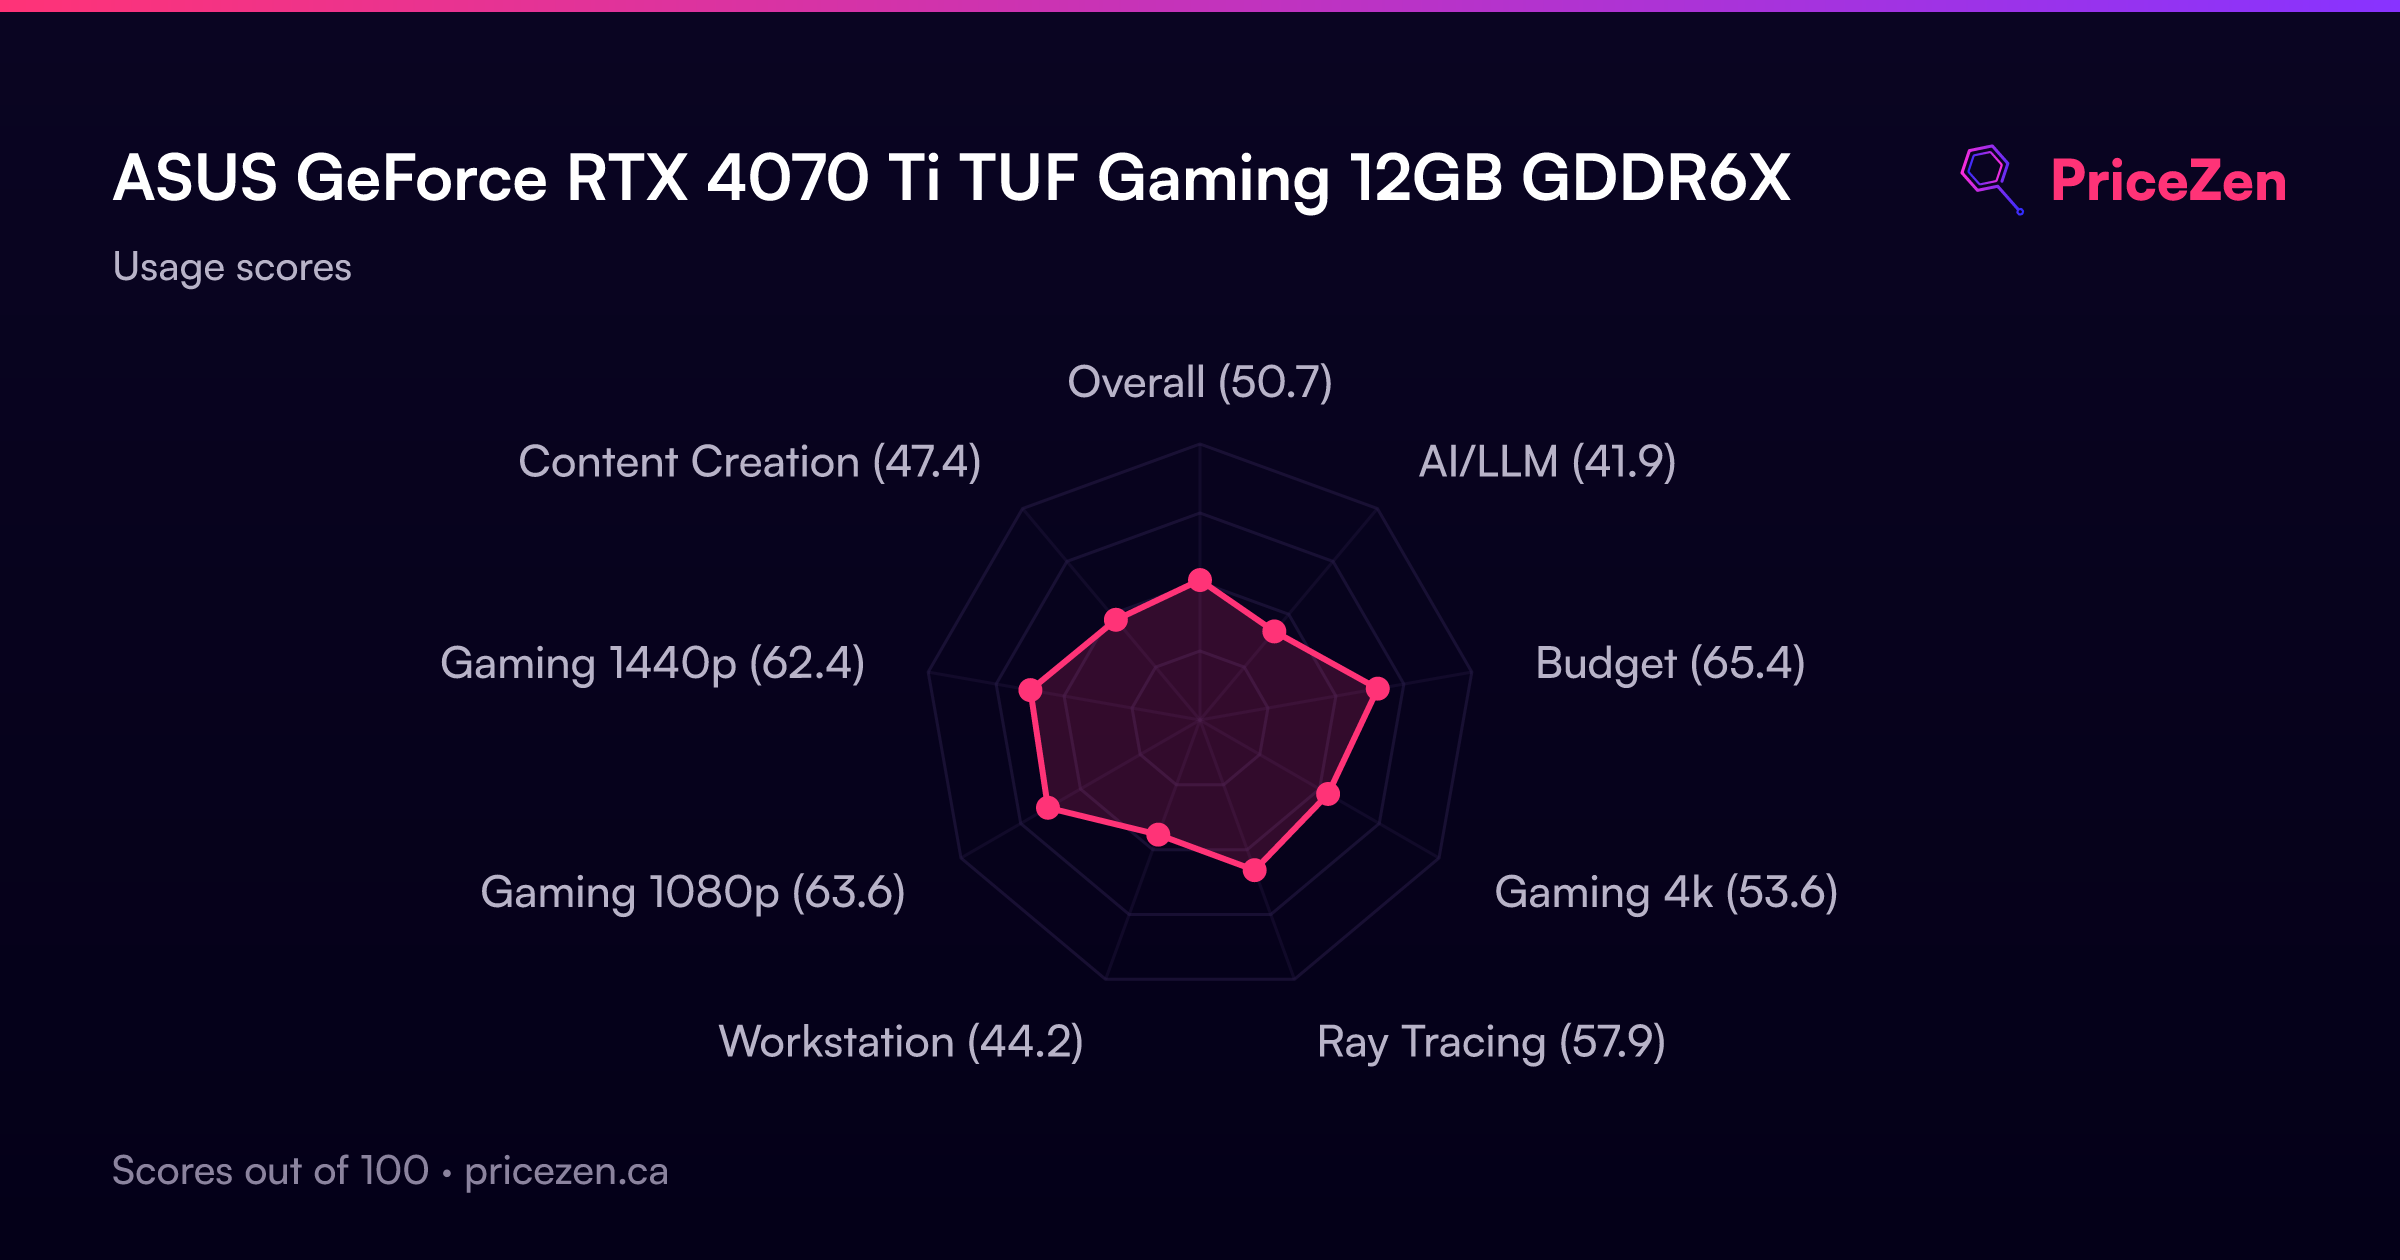
Usage Scores
- Overall50.7
- AI/LLM41.9
- Budget65.4
- Gaming 4k53.6
- Ray Tracing57.9
- Workstation44.2
- Gaming 1080p63.6
- Gaming 1440p62.4
- Content Creation47.4
A full written review is coming soon. The specs, scores, prices and charts above are always up to date.