Lenovo ThinkStation P3 Gen 2, Core Ultra 9 285, 32GB, 1TB SSD, RTX A400, Black
The 24-core Intel Core Ultra 9 285 and ISV-certified NVIDIA RTX A400 graphics deliver full workstation power in a 1-liter chassis that supports up to six independent displays. Its 1TB NVMe SSD and 32GB of RAM are packed into a 1.97kg build that mounts behind a monitor or travels between sites, backed by Windows 11 Pro and the Intel Q870 chipset. This system is best for architects, engineers, and finance professionals who need certified reliability and multi-display setups in space-constrained environments.
CPU Intel Core Ultra 9 285
RAM 32 GB
Storage 1 TB
GPU NVIDIA RTX A400 4 GB Graphics
Form Factor mini
OS Windows 11 Pro

61 Overall Score
No current retailer price
Snapshot
Pros & Cons
Pros
- Strong cpu (94th percentile) 94th
- Strong reliability (70th percentile) 70th
- Strong storage (69th percentile) 69th
- Strong gpu (66th percentile) 66th
Cons
- Below average port selection (13th percentile)
The proof
Performance
Specifications
Full Specifications
Processor
| CPU | Intel Core Ultra 9 285 |
| Cores | 24 |
| Frequency | 2.5 GHz |
| L3 Cache | 36 MB |
Graphics
| GPU | NVIDIA RTX A400 4 GB Graphics |
| Type | Discrete |
| VRAM | 4 GB |
| VRAM Type | GDDR6 |
Memory & Storage
| RAM | 32 GB |
| Storage | 1 TB |
| Storage Type | NVMe SSD |
Build
| Form Factor | mini |
| Weight | 2.0 kg / 4.3 lbs |
Connectivity
| Wi-Fi | Wireless LAN |
| Ethernet | Gigabit Ethernet |
System
| OS | Windows 11 Pro |
vs Competition
| Spec | Lenovo ThinkStation P3 Gen 2 | Apple Mac Studio M5 Max | Dell Desktop ECT1250 | HP OMEN GT16-0364 | ASUS ROG GM700 | MSI Aegis ZS2 A9NVP-1407US |
|---|---|---|---|---|---|---|
| CPU | Intel Core Ultra 9 285 | Apple M5 Max | Intel Core Ultra 7 265 | AMD Ryzen 7 8700F | AMD Ryzen 7 9800X3D | AMD Ryzen 9 9900X |
| RAM (GB) | 32 | 36 | 32 | 32 | 32 | 32 |
| Storage (GB) | 1024 | 1024 | 2048 | 1024 | 2048 | 2048 |
| GPU | NVIDIA RTX A400 4 GB Graphics | Apple (32-Core) | Intel UHD Graphics | NVIDIA GeForce RTX 5070 | NVIDIA GeForce RTX 5070 Ti | NVIDIA GeForce RTX 5070 |
| Form Factor | mini | mini | sff | mid-tower | mid-tower | mid-tower |
| Psu W | - | 480 | 180 | 850 | 850 | 750 |
| OS | Windows 11 Pro | macOS | Windows 11 Home | Windows 11 Home | Windows 11 Home | Windows 11 Home |
| Compare | Compare | Compare | Compare | Compare |
| Product | CPU | GPU | RAM | Ports | Storage | Reliability |
|---|---|---|---|---|---|---|
| Lenovo ThinkStation P3 Gen 2 | 94 | 65.7 | 63.9 | 12.8 | 68.8 | 69.9 |
| Apple Mac Studio M5 Max Compare | 95.7 | 85.2 | 92.4 | 89 | 68.8 | 99.3 |
| Dell Desktop ECT1250 Compare | 88.2 | 60.3 | 81.6 | 74.5 | 82.7 | 69.9 |
| HP OMEN GT16-0364 Compare | 69.5 | 90.8 | 87 | 97.9 | 53.5 | 69.9 |
| ASUS ROG GM700 Compare | 80.5 | 94.6 | 81.6 | 96 | 90 | 37.2 |
| MSI Aegis ZS2 A9NVP-1407US Compare | 92.4 | 90.8 | 87 | 90.4 | 82.7 | 37.2 |
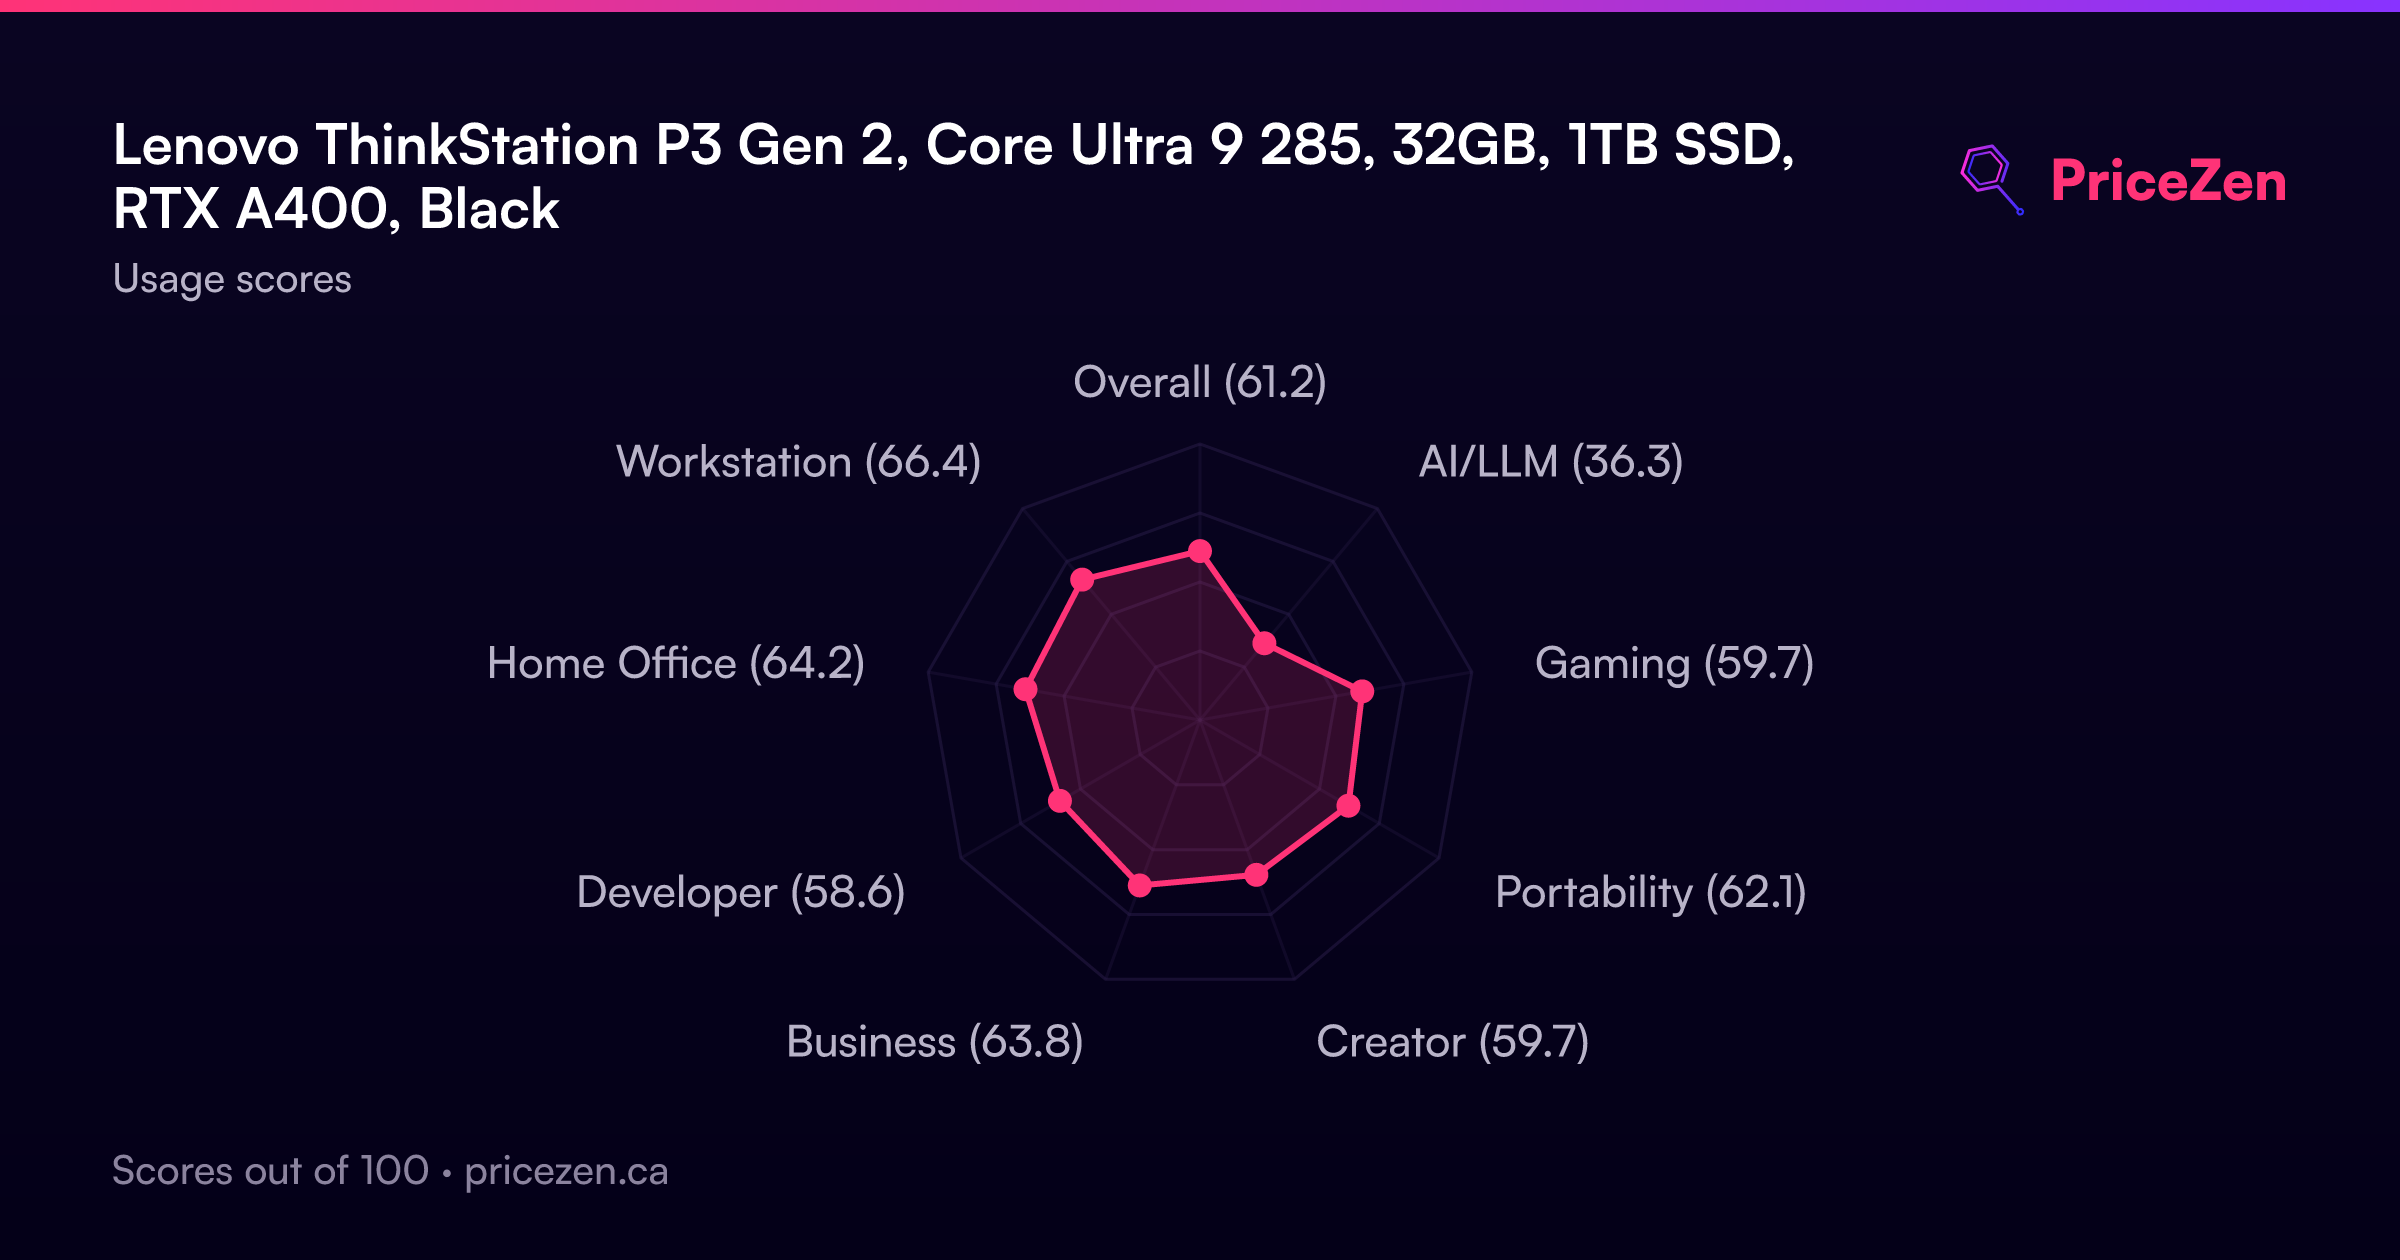
Usage Scores
- Overall61.2
- AI/LLM36.3
- Gaming59.8
- Portability62.1
- Creator59.7
- Business63.8
- Developer58.6
- Home Office64.1
- Workstation66.5
A full written review is coming soon. The specs, scores, prices and charts above are always up to date.
Other Configurations23
ThinkStation P3 Tiny Gen 2Intel Core Ultra 7 26516GB512GBBlackCA$2,147ThinkStation P3 Gen 2Intel Core Ultra 7 26516GB512GBBlackCA$2,445ThinkStation P3 Gen 2Intel Core Ultra 5 23516GB512GBBlackCA$2,626ThinkStation Gen 2Intel Core Ultra 7 26516GB512GBBlackCA$2,879ThinkStation P3 Gen 2Intel Core Ultra 5 23516GB512GBBlackCA$2,989ThinkStation P3 Tiny Gen 2Intel Core Ultra 7 26516GB512GBRaven BlackCA$3,399ThinkStation P3 Tiny Gen 2Intel Core Ultra 5 23532GB1TBCA$3,634ThinkStation P3 Tiny Gen 2Intel Core Ultra 7 26516GB512GBCA$3,717ThinkStation P3 Tiny Gen 2Intel Core Ultra 9 28516GB512GBMinimalistischCA$3,719
Show all 23 configurations
ThinkStation P3 Tiny Gen 2Intel Core Ultra 7 26532GB1TBCA$3,791ThinkStation P3 Tiny Gen 2Intel Core Ultra 9 28532GB1TBBlackCA$3,956ThinkStation P3 Tiny Gen 2Intel Core Ultra 7 26564GB1TBBlackCA$4,077ThinkStation P3 Tiny Gen 2Intel Core Ultra 9 28532GB1TBCA$4,235ThinkStation P3 Tiny Gen 2Intel Core Ultra 9 28564GB1TBCA$4,607ThinkStation P3 Tiny Gen 2Intel Core Ultra 9 28564GB1TBCA$4,621ThinkStation P3 Tiny Gen 2Intel Core Ultra 7 26532GB1TBBlackCA$4,770ThinkStation P3 Tiny Gen 2Intel Core Ultra 7 26532GB1TBCA$4,835ThinkStation P3 Tiny Gen 2Intel Core Ultra 5 22532GB1TBBlackCA$5,069ThinkStation P3 Tiny Gen 2Intel Core Ultra 9 28564GB1TBRaven BlackCA$6,749ThinkStation P3 Tiny Gen 2Intel Core Ultra 7 26564GB1TBThinkStation P3 Tiny Gen 2Intel Core Ultra 5 2258GB512GBBlackThinkStation P3 Gen 2Intel Core Ultra 7 26532GB1TBThinkStation P3 Gen 2Intel Core Ultra 9 28532GB2TBBlack