Dell OptiPlex 7060 Tiny Desktop Core i7-8700 3.20GHz 2018, 16GB, 512GB SSD
CPU Intel Core i7-8700
RAM 16 GB
Storage 512 GB
Form Factor mini
OS Windows 10 Pro

38 Overall Score
No current retailer price
Snapshot
Pros & Cons
Pros
- Strong reliability (70th percentile) 70th
Cons
- Below average port selection (5th percentile)
- Below average storage (29th percentile)
- Below average ram (31st percentile)
The proof
Performance
Specifications
Full Specifications
Processor
| CPU | Intel Core i7-8700 |
| Cores | 6 |
| Frequency | 3.2 GHz |
| L3 Cache | 12 MB |
Memory & Storage
| RAM | 16 GB |
| RAM Generation | DDR4 |
| Storage | 512 GB |
| Storage Type | SSD |
Build
| Form Factor | mini |
System
| OS | Windows 10 Pro |
vs Competition
| Spec | Dell OptiPlex 7060 Tiny Desktop Core i7-8700 3.20GHz | Apple Mac Studio M3 Ultra | Lenovo Legion 90YA003GUS | HP OMEN GT16-0364 | MSI Aegis Z2 C7NVP-1449US | iBUYPOWER Element EBI7N5701 |
|---|---|---|---|---|---|---|
| CPU | Intel Core i7-8700 | Apple M3 Ultra | Intel Core Ultra 7 265F | AMD Ryzen 7 8700F | AMD Ryzen 7 7700 | Intel Core Ultra 7 265F |
| RAM (GB) | 16 | 96 | 32 | 32 | 32 | 32 |
| Storage (GB) | 512 | 1024 | 1024 | 1024 | 1024 | 2048 |
| GPU | - | Apple M3 Ultra 60-core | NVIDIA GeForce RTX 5060 Ti | NVIDIA GeForce RTX 5070 | NVIDIA GeForce RTX 5070 | NVIDIA GeForce RTX 5070 |
| Form Factor | mini | sff | mid-tower | mid-tower | mid-tower | mid-tower |
| Psu W | - | - | 500 | 850 | 750 | 750 |
| OS | Windows 10 Pro | macOS | Windows 11 Home | Windows 11 Home | Windows 11 Home | Windows 11 Home |
| Compare | Compare | Compare | Compare | Compare |
| Product | CPU | GPU | RAM | Ports | Storage | Reliability |
|---|---|---|---|---|---|---|
| Dell OptiPlex 7060 Tiny Desktop Core i7-8700 3.20GHz | 36.8 | 36.7 | 31.4 | 5.3 | 29.3 | 70 |
| Apple Mac Studio M3 Ultra Compare | 99.7 | 77.6 | 95.7 | 93.6 | 53.5 | 99.3 |
| Lenovo Legion 90YA003GUS Compare | 90.5 | 83.5 | 81.6 | 93 | 68.8 | 70 |
| HP OMEN GT16-0364 Compare | 69.6 | 90.8 | 87.1 | 97.9 | 53.5 | 70 |
| MSI Aegis Z2 C7NVP-1449US Compare | 74.7 | 90.8 | 87.1 | 93.6 | 68.8 | 37.2 |
| iBUYPOWER Element EBI7N5701 Compare | 90.5 | 90.8 | 77.9 | 97.9 | 90 | 27.1 |
Price
Value & Pricing
We started tracking prices for this product on Oct 2, 2026. The chart appears once we have more data.
Usage Scores
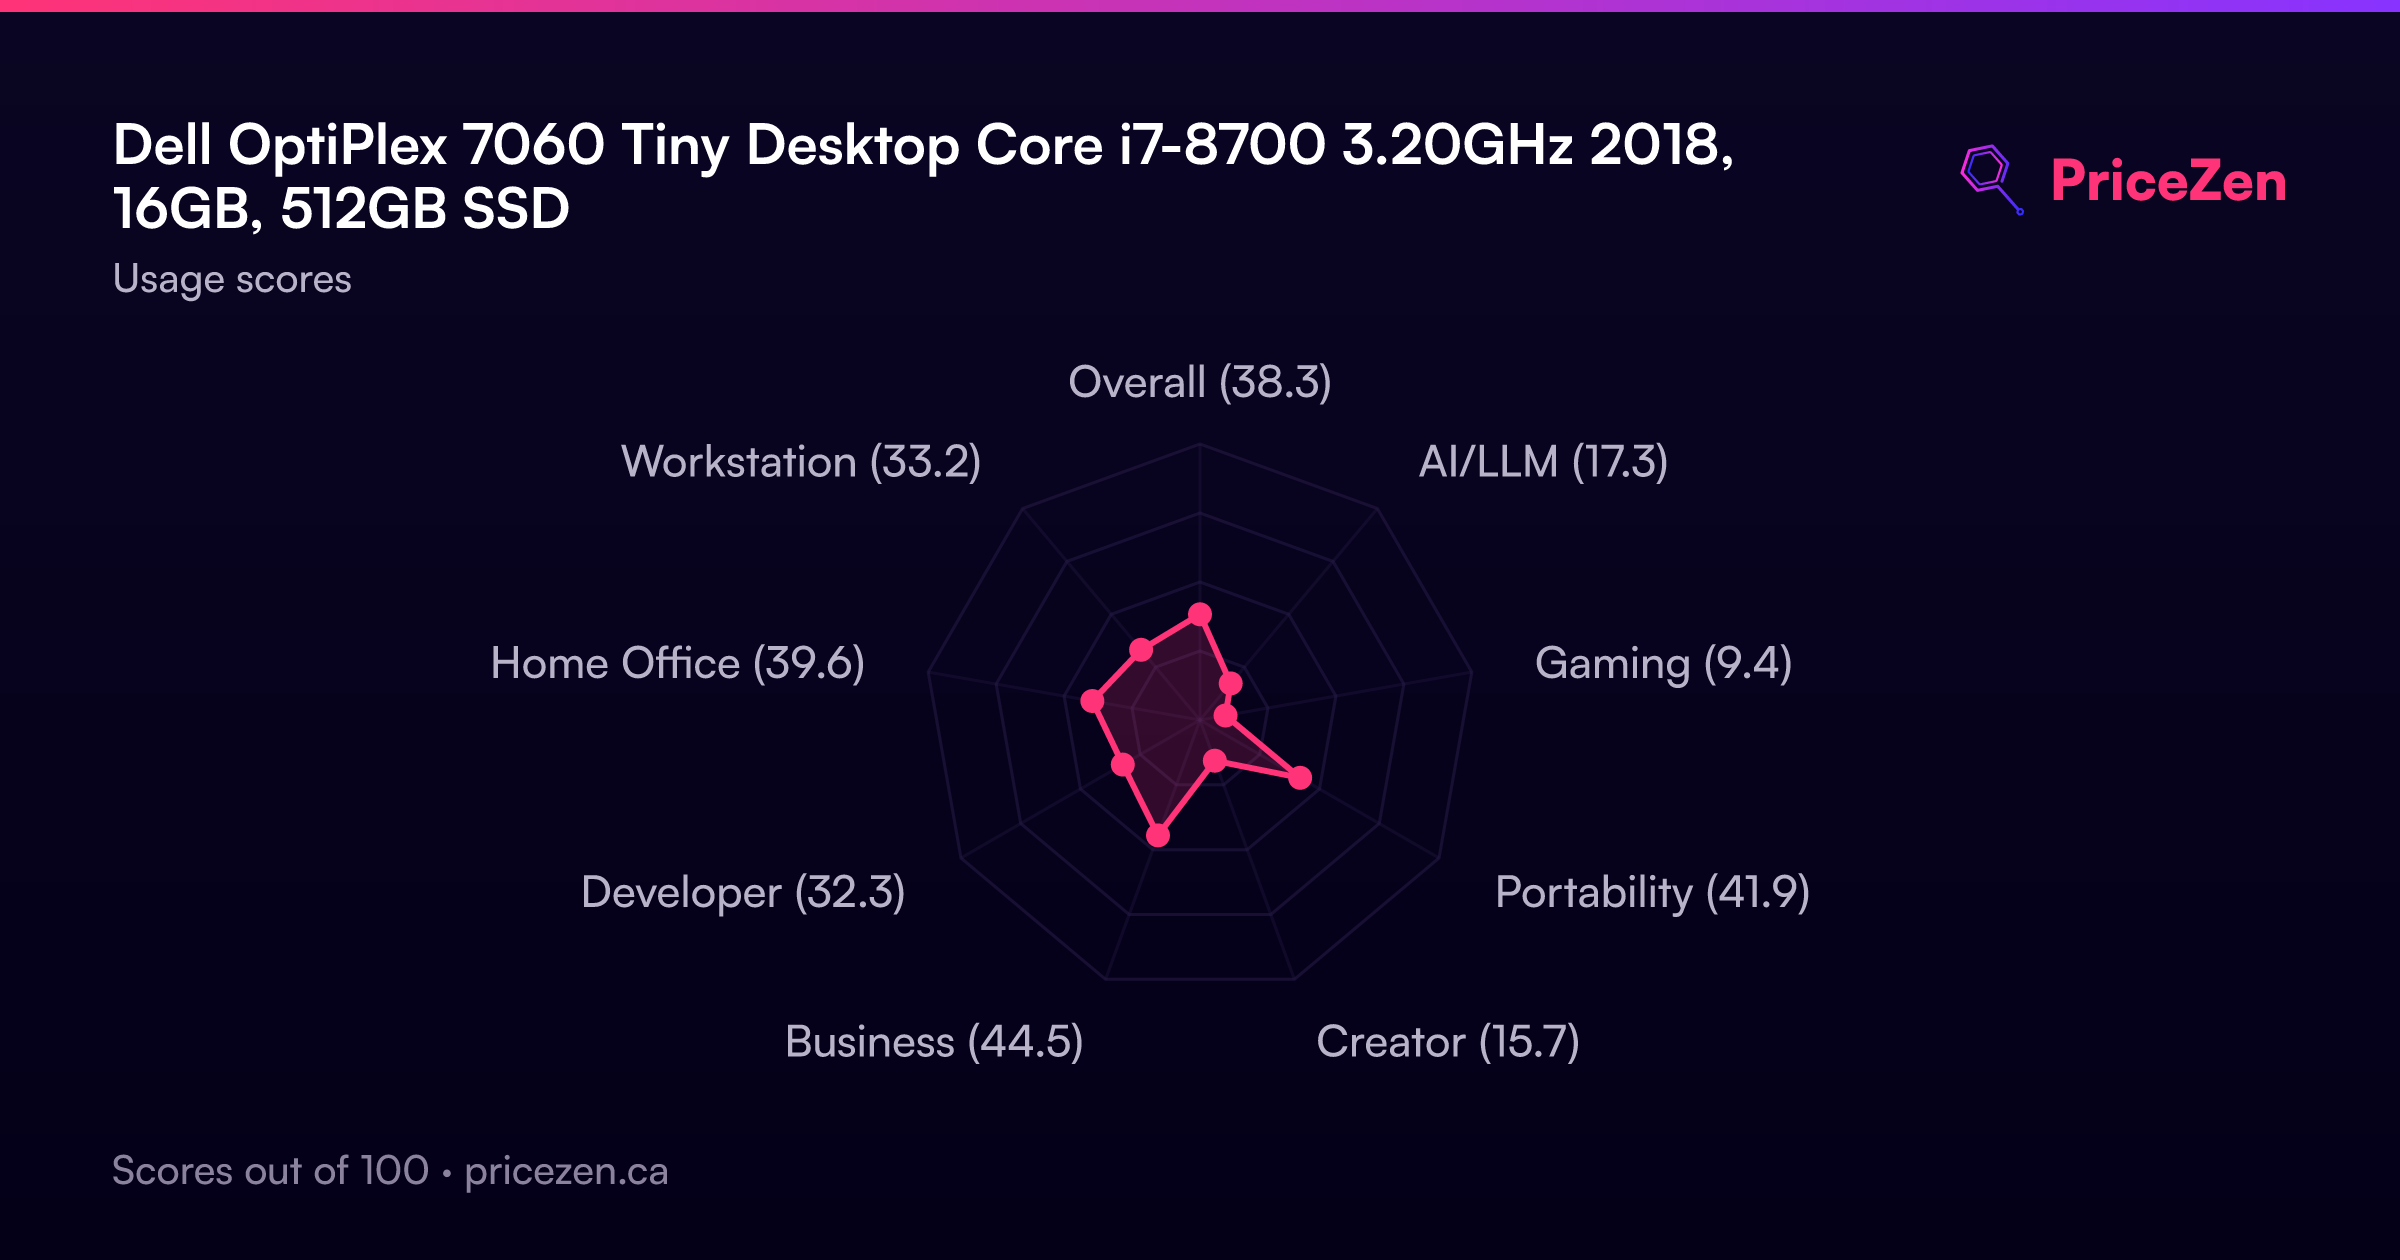
- Overall38.3
- AI/LLM17.3
- Gaming9.4
- Portability41.9
- Creator15.8
- Business44.5
- Developer32.3
- Home Office39.7
- Workstation33.2
A full written review is coming soon. The specs, scores, prices and charts above are always up to date.
Other Configurations25
OptiPlex 7060 MicroIntel Core i5 8500T16GB256GBBlackCA$270OptiPlex 7060 MicroIntel Core i5 8500T16GB256GBCA$280OptiPlex 7060Intel Core i5 8500T16GB512GBBlackCA$348OptiPlex 7060 MicroIntel Core i5 8500T8GB256GBBlackCA$380OptiPlex 7060 MicroIntel Core i7 8700T16GB256GBBlackCA$439OptiPlex 7060 MicroIntel Core i7 8700T32GB1TBBlackCA$600OptiPlex 7060Intel Core i7 8700T16GB1TBBlackCA$675OptiPlex 7060Intel Core i7 8700T32GB1TBBlackCA$675OptiPlex 7060 MicroIntel Core i7 8700T16GB512GBBlackCA$675
Show all 25 configurations
OptiPlex 7060Intel Core i7 8700T16GB512GBBlackCA$675OptiPlex Dell OptiPlex 7060 Micro PC ComputerIntel Core i5 850032GB1TBCA$700OptiPlex 7060Intel Core i7 8700T16GB256GBBlackCA$708OptiPlex 7060Intel Core i7-8700T16GB1152GBBlack/SilverCA$1,051OptiPlex 7060 MicroIntel Core i5 8500T16GB512GBBlackOptiPlex 7060Intel Core i5-8500T16GB256GBOptiPlex 7060 MicroIntel Core i5 9500T8GB250GBBlackOptiPlex 7060-MICROIntel Core i7 8700T32GB1TBBlackOptiPlex 7060 MicroIntel Core i5 8th Gen16GB512GBBlackOptiPlex 7060Intel Core i5 8500T32GB512GBBlackOptiPlex 7060Intel Core i5 8500T16GB128GBBlackOptiPlex 7060Intel Core i7 8700T32GB512GBBlackOptiPlex 7060Intel Core i5 8500T32GB1TBBlackOptiPlex 7060 MicroIntel Core i5 8500T16GB1TBBlackOptiPlex 7060 MicroIntel Core i7 8700T16GB1TBBlackOptiPlex 7060 MicroIntel Core i5 8500T32GB1TBBlack