Nouveau
Lenovo ThinkPad P16v Gen 3, Core Ultra 7 255H, 32GB, 1TB SSD, Black
CPU Intel Core Ultra 7 255H
RAM 32 GB
Storage 1 TB
Screen 16"
GPU NVIDIA RTX PRO 2000 Blackwell Generation
OS Windows 11 Pro
Weight 3.4 kg
Battery 90 Wh

55 Score global
Aucun prix actuel chez les marchands
Aperçu
Avantages et inconvénients
Points forts
- Strong cpu (87th percentile) 87th
- Strong gpu (86th percentile) 86th
- Strong reliability (82nd percentile) 82nd
- Strong ram (72nd percentile) 72nd
Points faibles
- Below average affordability (5th percentile)
- Below average portability (8th percentile)
- Below average port selection (15th percentile)
Les preuves
Performances
Caractéristiques techniques
Fiche technique complète
Processor
| CPU | Intel Core Ultra 7 255H |
| Cores | 16 |
| Frequency | 2.0 GHz |
| L3 Cache | 24 MB |
Graphics
| GPU | NVIDIA RTX PRO 2000 Blackwell Generation |
Memory & Storage
| RAM | 32 GB |
| Storage | 1 TB |
| Storage Type | SSD |
Display
| Size | 16" |
| Panel | OLED |
Connectivity
| Wi-Fi | Wi-Fi 7 |
Physical
| Weight | 3.4 kg / 7.6 lbs |
| Battery | 90 Wh |
| OS | Windows 11 Pro |
Face à la concurrence
| Spec | Lenovo ThinkPad P16v Gen 3 | Apple MacBook Pro 14.2" M4 Max | ASUS ROG Zephyrus 14" GA403WW-G14.R95080 | HP OMEN Transcend | Samsung Galaxy Book5 Pro 14" NP944XHA-KG3US | Dell Premium 14.5" LDA14250-7667SLV-PUS |
|---|---|---|---|---|---|---|
| CPU | Intel Core Ultra 7 255H | Apple M4 Max | AMD Ryzen AI 9 HX 370 | Intel Core Ultra 9 285H | Intel Core Ultra 7 258V | Intel Core Ultra 7 255H |
| RAM (GB) | 32 | 64 | 32 | 32 | 32 | 32 |
| Storage (GB) | 1024 | 4096 | 2048 | 1024 | 1024 | 1024 |
| Screen | 16" | 14.2" 3024x1964 | 14" 2880x1800 | 14" 2880x1800 | 14" 2880x1800 | 14.5" 3200x2000 |
| GPU | NVIDIA RTX PRO 2000 Blackwell Generation | Apple (40-Core) | NVIDIA GeForce RTX 5080 | NVIDIA GeForce RTX 5070 | Intel Arc Graphics 140V | Intel Arc Graphics |
| OS | Windows 11 Pro | macOS | Windows 11 Home | Windows 11 Home | Windows 11 Pro | Windows 11 Home |
| Weight (kg) | 3.4 | 1.6 | 1.6 | 1.6 | 1.2 | 1.7 |
| Battery (Wh) | 90 | 72 | - | 71 | 63 | 62 |
| Compare | Compare | Compare | Compare | Compare |
| Produit | CPU | GPU | RAM | Connectique | Écran | Portabilité | Stockage | Fiabilité | Affordability |
|---|---|---|---|---|---|---|---|---|---|
| Lenovo ThinkPad P16v Gen 3 | 87.1 | 86.3 | 72 | 14.8 | 71.1 | 8.3 | 65.2 | 82.1 | 5.2 |
| Apple MacBook Pro 14.2" M4 Max Compare | 93.7 | 91.6 | 95.7 | 73.2 | 99.3 | 68.9 | 98.5 | 98.3 | 1.7 |
| ASUS ROG Zephyrus 14" GA403WW-G14.R95080 Compare | 91.2 | 98.3 | 90.9 | 89.2 | 96.5 | 73.6 | 89.7 | 60.6 | 5.7 |
| HP OMEN Transcend Compare | 90.1 | 93.5 | 89.7 | 89.2 | 96.5 | 72.3 | 65.2 | 33.6 | 8.4 |
| Samsung Galaxy Book5 Pro 14" NP944XHA-KG3US Compare | 65.8 | 69.6 | 79.4 | 83.1 | 91.6 | 89.5 | 79.2 | 82.1 | 20.1 |
| Dell Premium 14.5" LDA14250-7667SLV-PUS Compare | 87.1 | 69.6 | 89 | 65.9 | 97.2 | 61.2 | 65.2 | 33.6 | 14 |
Prix
Rapport qualité-prix
Nous suivons les prix de ce produit depuis le 10 nov. 2026. Le graphique apparaîtra dès que nous aurons plus de données.
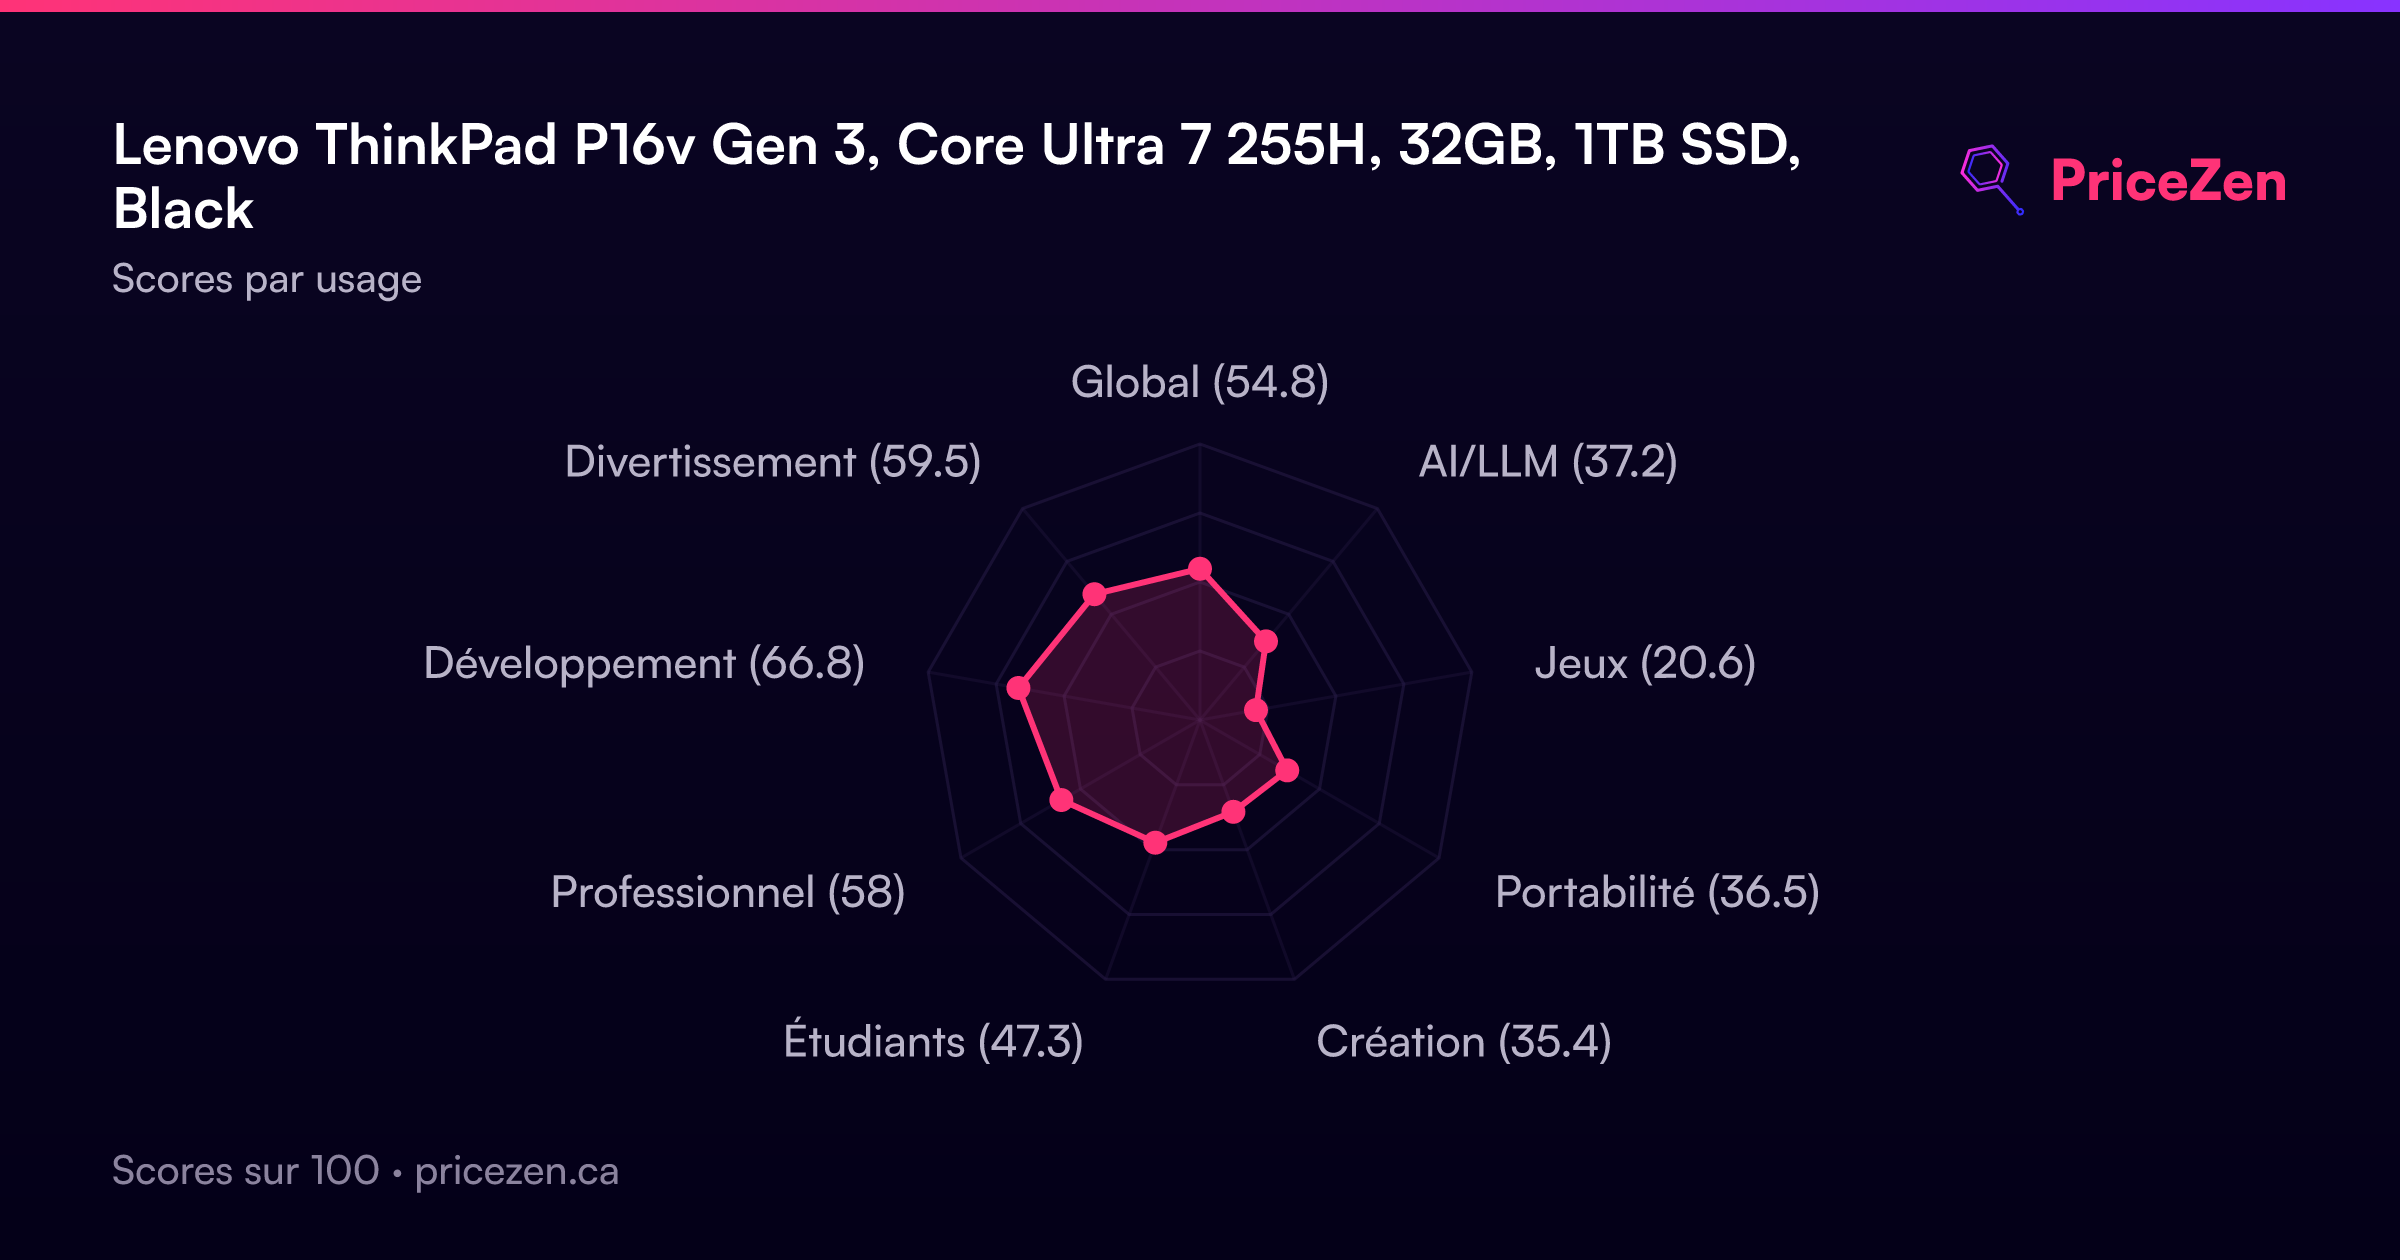
Scores par usage
- Global55
- AI/LLM37.3
- Jeux20.7
- Portabilité36.8
- Création35.6
- Étudiants47.5
- Professionnel58.1
- Développement67.1
- Divertissement60.2
Un test complet arrive bientôt. Les caractéristiques, scores, prix et graphiques ci-dessus sont toujours à jour.
Autres configurations13
ThinkPad P16v Gen 3Intel Core Ultra 7 265H16GB512GBBlack3 748 $CAThinkPad P16v Gen 3Intel Core Ultra 7 265H16GB512GB4 115 $CAThinkPad P16v Gen 3Intel Core Ultra 7 265H32GB1TB4 506 $CAThinkPad P16v Gen 3Intel Core Ultra 7 265H32GB1TBBlack4 775 $CAThinkPad P16v Gen 3Intel Core Ultra 7 265H32GB1TB5 208 $CAThinkPad P16v Gen 3Intel Core Ultra 9 285H32GB1TBBlack5 449 $CAThinkPad P16v Gen 3Intel Core Ultra 9 285H64GB1TB5 499 $CAThinkPad P16v Gen 3Intel Core Ultra 7 265H64GB2TB6 739 $CAThinkPad P16v Gen 3Intel Core Ultra 7 265H96GB2TB7 512 $CA